Where The Money Is Made & Lost: The Twelve Months
Part 1: Where The Money Is Made & Lost
Part 2: Presidential Cycles
Part 3: The Four Quarters
Part 4: The Twelve Months
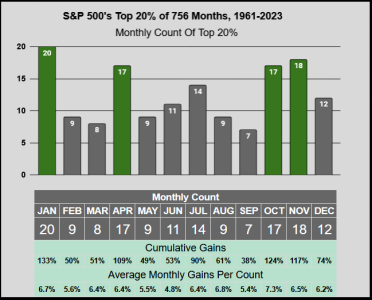
Here’s the Top 20%, Middle 60% & Bottom 20% of months sorted into each of the 12 months.
Truncated: Our monthly Top & Bottom 20% are “outliers”. When it’s really good or bad, these are the months which have frequently given us extreme gains & losses.
Case in point, for the Top 20%, Jan, Apr, Oct, & Nov have the highest frequency of Top-20% months, but it should be noted this did not provide us the best 4-month return. Fair warning, investing in these 4-months alone will have yielded 26% of the S&P 500’s 63-year’s worth of gains (26% gains for 33% Risk = not a great return).
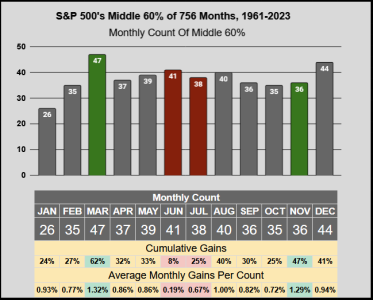
Across the Middle 60%, our 454 monthly count shows us the months of Mar & Nov have the highest gains per count, while Jun & Jul have the lowest gains per count.
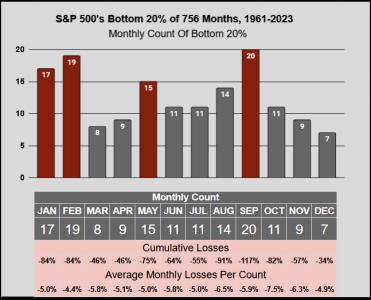
For the Bottom 20%, Jan, Feb, May, & Sep have the highest frequency of Bottom 20% months. While this isn’t the best four months to go to cash, it can shave off some risk. Going to cash during these 4 months, yielded 94% of the S&P 500’s 63-year’s worth of gains (94% gains for 66% Risk = decent return for low risk).
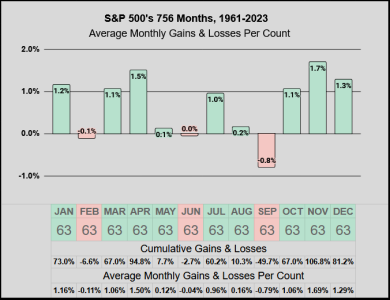
The key takeaway: This next chart is a consolidation of the previous three. Generally speaking, there’s been a universal 63-year-specific truth. The months of Feb, Jun, & Sep might be a good time to take some risk off, particularly if the market's conditions are already not good.
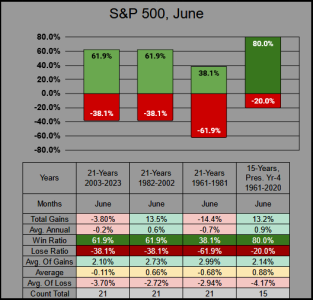
Bonus, Next Month's June: On longer time frames June is a good time to take risk off, but when we break the data down into three 21-Year increments and the 4th Year of the Presidential Cycle, we can see the results from a different perspective. June isn't necessarily a bad month, it just has bad timing. The Month of June tends to get caught in the crossfire of some other month's drama.
2003-2023 had a solid win ratio, but was offset with larger losses. June 2008/2010/2022 lost a combined -22.4% (Financial Crisis, Flash Crash, Russian invasion)
1982-2002 also had a solid win ratio, but the average returns were on the low side. These 21 months of June contributed just .6% of the 29.4% average yearly return (2000-2002 -50% Bear Market).
1961-1982 was bad for June, with a 38.1% win ratio. June of 62/65/69/70 combined lost -26.5% (62-Bear Market, 65-Correction, 68-70-Bear Market)
Lastly we have the 4th year of the Presidential Cycle with 15 months of June. The win ratio is impressive, it is the best of the 4-Year Cycle, with the 2nd best return. June 2008's -8.60% took a large chunk of the gains away.
This concludes this mini-series blog, thanks for reading...Jason
Part 1: Where The Money Is Made & Lost
Part 2: Presidential Cycles
Part 3: The Four Quarters
Part 4: The Twelve Months
Here’s the Top 20%, Middle 60% & Bottom 20% of months sorted into each of the 12 months.
Truncated: Our monthly Top & Bottom 20% are “outliers”. When it’s really good or bad, these are the months which have frequently given us extreme gains & losses.
Case in point, for the Top 20%, Jan, Apr, Oct, & Nov have the highest frequency of Top-20% months, but it should be noted this did not provide us the best 4-month return. Fair warning, investing in these 4-months alone will have yielded 26% of the S&P 500’s 63-year’s worth of gains (26% gains for 33% Risk = not a great return).

Across the Middle 60%, our 454 monthly count shows us the months of Mar & Nov have the highest gains per count, while Jun & Jul have the lowest gains per count.

For the Bottom 20%, Jan, Feb, May, & Sep have the highest frequency of Bottom 20% months. While this isn’t the best four months to go to cash, it can shave off some risk. Going to cash during these 4 months, yielded 94% of the S&P 500’s 63-year’s worth of gains (94% gains for 66% Risk = decent return for low risk).

The key takeaway: This next chart is a consolidation of the previous three. Generally speaking, there’s been a universal 63-year-specific truth. The months of Feb, Jun, & Sep might be a good time to take some risk off, particularly if the market's conditions are already not good.

Bonus, Next Month's June: On longer time frames June is a good time to take risk off, but when we break the data down into three 21-Year increments and the 4th Year of the Presidential Cycle, we can see the results from a different perspective. June isn't necessarily a bad month, it just has bad timing. The Month of June tends to get caught in the crossfire of some other month's drama.
2003-2023 had a solid win ratio, but was offset with larger losses. June 2008/2010/2022 lost a combined -22.4% (Financial Crisis, Flash Crash, Russian invasion)
1982-2002 also had a solid win ratio, but the average returns were on the low side. These 21 months of June contributed just .6% of the 29.4% average yearly return (2000-2002 -50% Bear Market).
1961-1982 was bad for June, with a 38.1% win ratio. June of 62/65/69/70 combined lost -26.5% (62-Bear Market, 65-Correction, 68-70-Bear Market)
Lastly we have the 4th year of the Presidential Cycle with 15 months of June. The win ratio is impressive, it is the best of the 4-Year Cycle, with the 2nd best return. June 2008's -8.60% took a large chunk of the gains away.

This concludes this mini-series blog, thanks for reading...Jason
