For the 5th week in a row, the Top 50 have a stock allocation of at least 96%. And it's been quite profitable for those with the temerity to maintain a high degree of stock exposure. On a weekly basis, the S&P 500 has closed with a gain for the last 7 weeks. Although the last two weeks only saw relatively modest price increases. But a gain is a gain. I should also point out that the "S" fund saw more upside price appreciation than did the S&P.
Here's this week's charts:
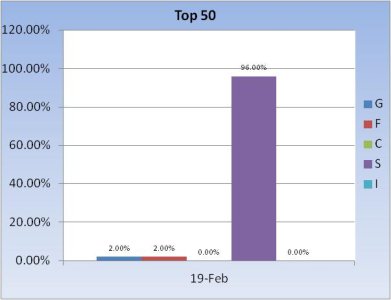
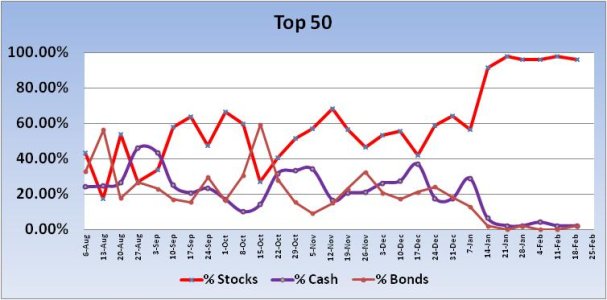
This week's Top 50 profile saw very little change from last week. Small/Mid caps have been the place to be (S Fund) and that's where this group is.
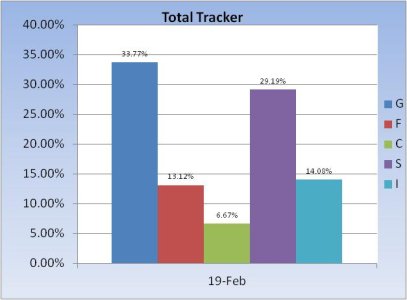
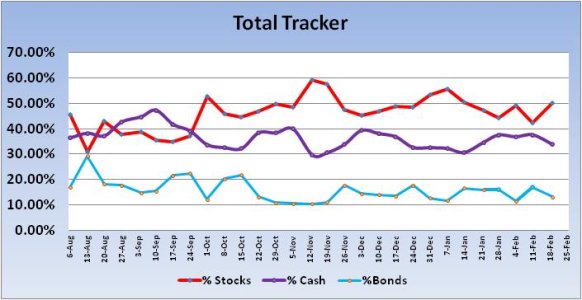
The Total Tracker saw stock allocations increase by 7.64%, from 42.3% last week to 49.94% this week.
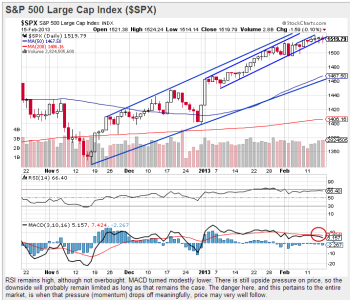
Our sentiment survey was on a buy last week, and that was a good signal. This week, it's more neutral. But sentiment is very bullish (bearish) in other surveys. Overall, it's a mixed picture on the sentiment front. All that's really mattered so far this year is upside momentum, and that's still with us. Be that as it may, many technical indicators are showing signs of weakening, so we could start seeing more selling pressure than we have in the days and weeks ahead.
Here's this week's charts:


This week's Top 50 profile saw very little change from last week. Small/Mid caps have been the place to be (S Fund) and that's where this group is.


The Total Tracker saw stock allocations increase by 7.64%, from 42.3% last week to 49.94% this week.

Our sentiment survey was on a buy last week, and that was a good signal. This week, it's more neutral. But sentiment is very bullish (bearish) in other surveys. Overall, it's a mixed picture on the sentiment front. All that's really mattered so far this year is upside momentum, and that's still with us. Be that as it may, many technical indicators are showing signs of weakening, so we could start seeing more selling pressure than we have in the days and weeks ahead.
