Last week I said the Total Tracker remained very conservative with their stock allocations. Historically speaking, stock allocations under 40% tend to portend market strength. And last week was no exception as the Total Tracker's buy signal helped ascertain market direction again. For the week, the C fund jumped another 2.14%, the S fund increased by 1.89% and the I fund managed to post a 0.45% gain. Dollar strength is tempering I fund gains. Please keep in mind that the buy signals triggered by the auto-tracker are not stand-alone signals, but provide further context of market action when used in conjunction with other indicators. And those other indicators that I use remain largely bullish going into the new trading week.
This week, the Top 50 had a modest decrease in stock allocations (no signal), while the Total Tracker showed a modest increase in stock allocations, but remained below 40% total stock exposure. That's another buy signal.
Here's the charts:
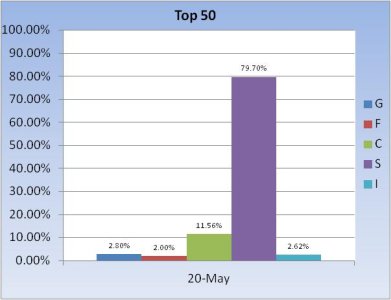
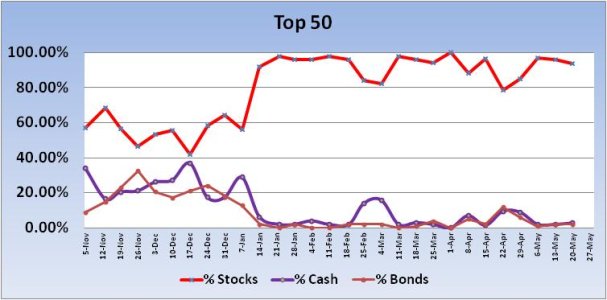
Not much change in the Top 50. Total stock exposure dipped by 2.12%, from 96% to 93.88%.
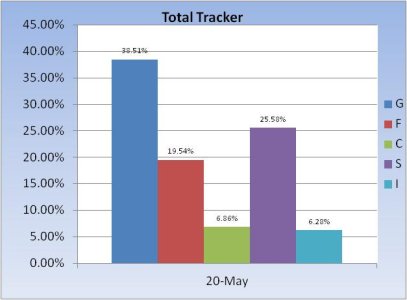
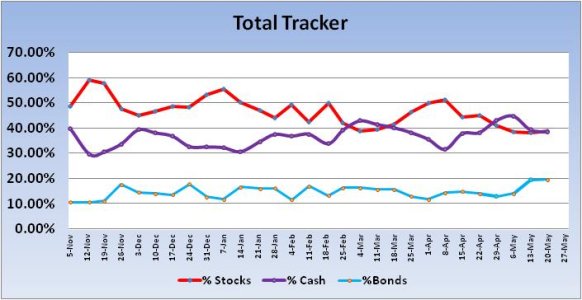
The Total Tracker showed a modest increase in stock exposure of just 0.43%, going from a total stock allocation of 38.29% to 38.72%. That keeps it in a buy condition.
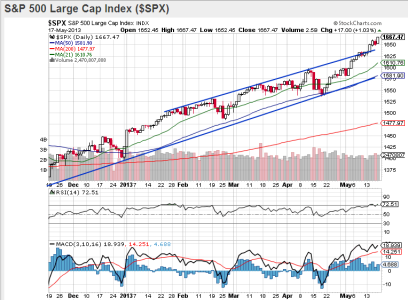
Looking at the S&P 500, we can see price is rising further above that upper trend line. If it remains there much longer, that upper trend line will become support. The 21 day moving average is lifting higher off the 50 dma. RSI remains very strong, but overbought, while MACD is also strong. The context here is not to get too concerned about overbought conditions at this time as underlying support for this market remains in place. Until that changes, downside action will more than likely continue to be limited. This can happen quickly, but there is still a lot of traders and investors underexposed in this market. So any dip we do get will more than likely continue to be bought.
Our sentiment survey was largely neutral, but remains on a buy.
We are due a pullback, but under current market conditions I cannot be bearish here.
This week, the Top 50 had a modest decrease in stock allocations (no signal), while the Total Tracker showed a modest increase in stock allocations, but remained below 40% total stock exposure. That's another buy signal.
Here's the charts:


Not much change in the Top 50. Total stock exposure dipped by 2.12%, from 96% to 93.88%.


The Total Tracker showed a modest increase in stock exposure of just 0.43%, going from a total stock allocation of 38.29% to 38.72%. That keeps it in a buy condition.

Looking at the S&P 500, we can see price is rising further above that upper trend line. If it remains there much longer, that upper trend line will become support. The 21 day moving average is lifting higher off the 50 dma. RSI remains very strong, but overbought, while MACD is also strong. The context here is not to get too concerned about overbought conditions at this time as underlying support for this market remains in place. Until that changes, downside action will more than likely continue to be limited. This can happen quickly, but there is still a lot of traders and investors underexposed in this market. So any dip we do get will more than likely continue to be bought.
Our sentiment survey was largely neutral, but remains on a buy.
We are due a pullback, but under current market conditions I cannot be bearish here.
