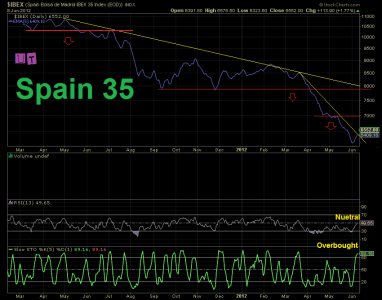
Spain’s IBEX Spain’s IBEX has fallen below an accelerated downward sloping trendline. RSI is neutral and short term slow stochastic is overbought. This chart looks terrible.

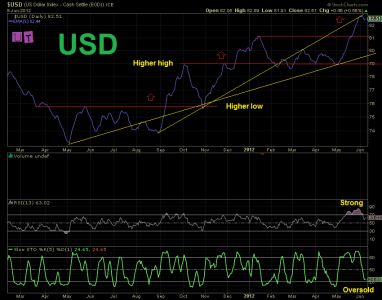
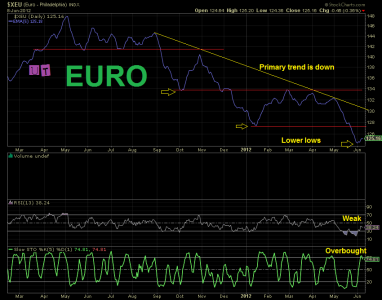
US Dollar and the Euro. The USD is a bullish chart. We see a series of higher highs and higher lows, and then a surge to new highs, taking out the previous momentum high. RSI is strong, and will get stronger when it exceeds 67. Short term slow stochastic is nearing oversold. The 5 ema was recently contained by an upper chart resistance trendline, but now has room to move higher. Meanwhile, the Euro shows a primary trend that is down, with a series of lower lows. RSI is weak and the short term slow stochastic is overbought.


US Dollar and the Euro. The USD is a bullish chart. We see a series of higher highs and higher lows, and then a surge to new highs, taking out the previous momentum high. RSI is strong, and will get stronger when it exceeds 67. Short term slow stochastic is nearing oversold. The 5 ema was recently contained by an upper chart resistance trendline, but now has room to move higher. Meanwhile, the Euro shows a primary trend that is down, with a series of lower lows. RSI is weak and the short term slow stochastic is overbought.


