So this week's sentiment survey shows 57% bulls vs. 35% bears, but all this bullishness isn't showing up in stock allocations across the auto-tracker. For the fourth week in a row stock allocations have dropped. This time by 1.55% to a total stock allocation of just 40.12%. Statistically, the market tends to rise when allocations drop below 40% and we're pretty close to that level now. Even if the major averages fail to rise next week, it still implies some measure of support for the market overall. Of course, selling into strength during the weak seasonal period isn't a bad idea so I can understand why it is happening. It's the timing that's the tricky part as we can't be sure how far the indexes will advance. Especially with underlying support for this market being as strong as it has been of late.
So while I am on the bullish side next week myself, I do note that there are some headwinds to deal with as we come to the end of the third quarter. I would normally expect window dressing to be a big factor as we head into the last full trading week of the quarter; especially given the recent rally and the likeliness that many money managers are probably on the wrong side of the market and looking to dress up their portfolios. But the week after September OPEX (which was last Friday) the DOW has been down 17 of last 22 with an average loss of 1.2%. And market breadth fell off hard on Friday, which is a bit of a concern as breadth is a good indication of underlying market support (liquidity). And the last week of September in 2012 saw the C, S and I funds fall 1.3%, 1.83%, and 2.68% respectively in spite of total stock allocations of just 37.01%. So I have my reservations in spite of my modestly bullish stance for next week.
Here's this week's charts:
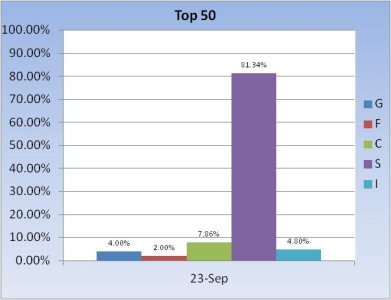
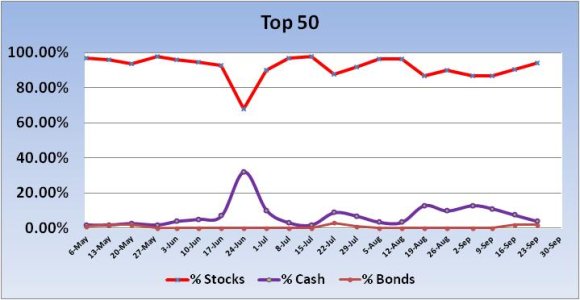
No signal from the Top 50 this week. For the new trading week, total stock allocations rose by 3.6% to a total stock allocation of 94%. I consider this bullish longer term.
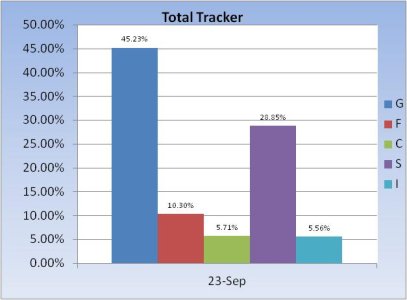
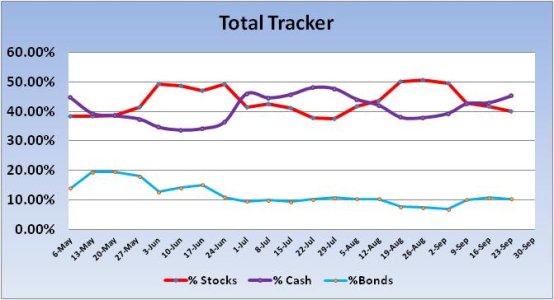
No “official” signal was generated from the Total Tracker this week. But the odds favor a weekly rally when total stock allocation dip across the Auto Tracker (Total Tracker) in any given week. And this week, they fell by 1.55% to a total stock allocation of just 40.12%. And when total allocations fall below 40%, that is bullish too. We may be close enough.
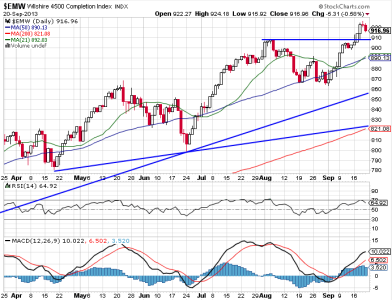
Price on the Wilshire 4500 (equivalent to the S fund) hit an all-time high this past week, breaking above resistance midweek, but retreating a bit by the end of the week. Momentum is positive and is not yet indicating a turn, but RSI dipped some although it does remain very positive.
So it's a mixed picture for this coming week.
To see this week's full analysis, follow this link http://www.tsptalk.com/members/
So while I am on the bullish side next week myself, I do note that there are some headwinds to deal with as we come to the end of the third quarter. I would normally expect window dressing to be a big factor as we head into the last full trading week of the quarter; especially given the recent rally and the likeliness that many money managers are probably on the wrong side of the market and looking to dress up their portfolios. But the week after September OPEX (which was last Friday) the DOW has been down 17 of last 22 with an average loss of 1.2%. And market breadth fell off hard on Friday, which is a bit of a concern as breadth is a good indication of underlying market support (liquidity). And the last week of September in 2012 saw the C, S and I funds fall 1.3%, 1.83%, and 2.68% respectively in spite of total stock allocations of just 37.01%. So I have my reservations in spite of my modestly bullish stance for next week.
Here's this week's charts:


No signal from the Top 50 this week. For the new trading week, total stock allocations rose by 3.6% to a total stock allocation of 94%. I consider this bullish longer term.


No “official” signal was generated from the Total Tracker this week. But the odds favor a weekly rally when total stock allocation dip across the Auto Tracker (Total Tracker) in any given week. And this week, they fell by 1.55% to a total stock allocation of just 40.12%. And when total allocations fall below 40%, that is bullish too. We may be close enough.

Price on the Wilshire 4500 (equivalent to the S fund) hit an all-time high this past week, breaking above resistance midweek, but retreating a bit by the end of the week. Momentum is positive and is not yet indicating a turn, but RSI dipped some although it does remain very positive.
So it's a mixed picture for this coming week.
To see this week's full analysis, follow this link http://www.tsptalk.com/members/
