Last week I pointed out to you that the herd had gotten bulled up by more than 10% to begin the new week. An allocation shift of more than 10% since last July 6th (according to my spreadsheets) revealed the herd had been correct 5 of 7 times on that large a shift. But they didn't win this time. It was a volatile to week to be sure, but the major averages posted losses for the week at Friday's close, and I was only looking at week to week performance. So make it 5 times out of 8 that they've been correct.
Let's see how things shape for this week:


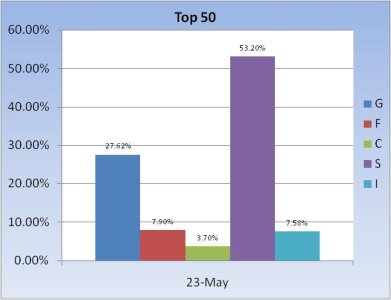
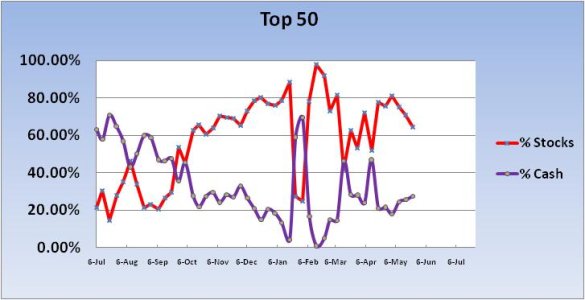
The most noteworthy thing that I see for the Top 50 this week is that they've reduced their stock allocations for the third straight week. Considering the trend since May 2nd has been down, that would imply they've recognized the weakness this market is showing and have been reducing exposure accordingly. But they're still 64.48% invested, which is moderately bullish.


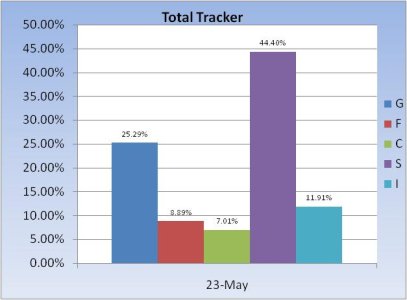
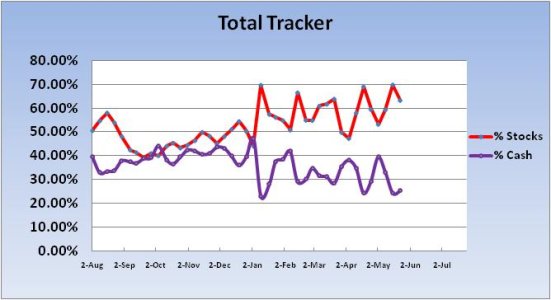
The herd took a bit off the table this week. They reduced their exposure by 6.55% and now have a total stock allocation of 63.32%. That's moderately bullish too.
I'm not surprised by the relatively healthy stock allocations for both groups. After all, the Fed is still supporting this market, even if QE2 is scheduled to end on June 30th. But the chances for a correction are probably as high as they've been since this bull market took off in early September, 2010. Doesn't mean we'll get a correction, but we are certainly seeing weakness and some of the technicals are deteriorating (like BPCOMPQ). It's been somewhat orderly for the most part too. But I'm thinking there's more downside to come, and it could take a few weeks to play out. Then we'll probably see another sustained move to the upside. That's my crystal ball view anyway. But as always, I'll be watching the Seven Sentinels for trending clues.
Let's see how things shape for this week:


The most noteworthy thing that I see for the Top 50 this week is that they've reduced their stock allocations for the third straight week. Considering the trend since May 2nd has been down, that would imply they've recognized the weakness this market is showing and have been reducing exposure accordingly. But they're still 64.48% invested, which is moderately bullish.


The herd took a bit off the table this week. They reduced their exposure by 6.55% and now have a total stock allocation of 63.32%. That's moderately bullish too.
I'm not surprised by the relatively healthy stock allocations for both groups. After all, the Fed is still supporting this market, even if QE2 is scheduled to end on June 30th. But the chances for a correction are probably as high as they've been since this bull market took off in early September, 2010. Doesn't mean we'll get a correction, but we are certainly seeing weakness and some of the technicals are deteriorating (like BPCOMPQ). It's been somewhat orderly for the most part too. But I'm thinking there's more downside to come, and it could take a few weeks to play out. Then we'll probably see another sustained move to the upside. That's my crystal ball view anyway. But as always, I'll be watching the Seven Sentinels for trending clues.
