Here’s a quick Q2 review:
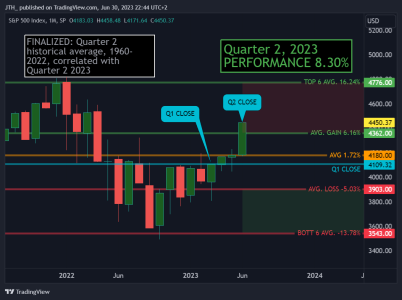
Q2 2023 closed up 8.30%.
From 1960, Q2 2023, ranked as the 10th best of 64 Q2s placing it in the Top 15%. Of the past 254 quarters, it ranked 48th, placing it in the Top 20%. Each of the past three quarters have closed up more than 7%.
NOTE: All candlestick charts are the Monthly S&P 500.
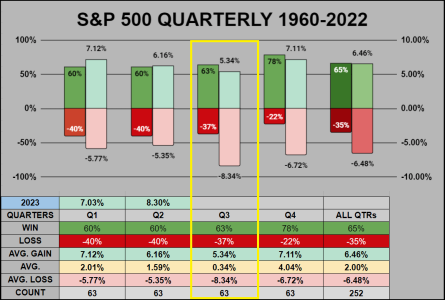
Historically, Q3 is the worst performing of the four quarters.
It has the 2nd best win ratio at 63% (but still below the 252 quarterly win ratio of 65%)
It has the smallest average-of-all-gains at 5.37%.
It has the smallest average at .34%.
It has the largest average-of-all-loses at -8.34%.
Digging down into Q3.
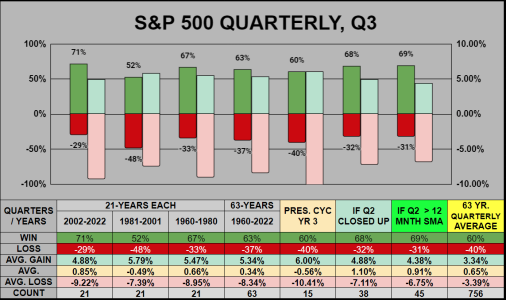
The good news. The past 21 years have a 71% win ratio (above the 63-year all quarter win ratio of 60%). When Q2 closed up, Q3 had a 68% win ratio. When Q2 closed above the 12-Month SMA, Q3 had a 69% win ratio. When Q3 closed up, the average-of-all-gains was higher than the 63-Yr Qrtly average. The bad news, when Q3 closed down, the average-of-all-losses was worse than the 63-Yr Qrtly average.
Estimating a projection.
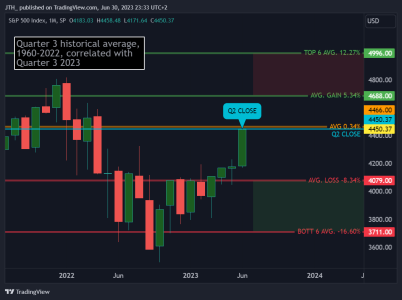
For Q3 (based on historical averages), buyers may want to step in (at or below) 4079 which is also an area of previous resistance. Sellers may want to step out (at or above) 4688, an area about 3% below 2022’s all time high.
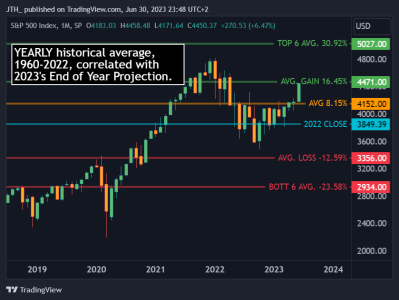
Lastly as a word of caution, we’ve closed 16.34% YTD which is just short of the 63-year 16.45% average-of-all-gains. Thus far while not unheard of, given the 2 Fed rate hikes ahead, these current levels are impressive. With just 6 months left in 2023, it will be interesting to see both "if" and "how" these 2 forecasted rate hikes are digested by the markets. The current PE ratio on the S&P 500 is 25.76 (getting pricy) and well above the Mean & Median, so it might be nice to get a pullback this quarter, to keep buyers interested.
Q2 2023 closed up 8.30%.
From 1960, Q2 2023, ranked as the 10th best of 64 Q2s placing it in the Top 15%. Of the past 254 quarters, it ranked 48th, placing it in the Top 20%. Each of the past three quarters have closed up more than 7%.
NOTE: All candlestick charts are the Monthly S&P 500.

Historically, Q3 is the worst performing of the four quarters.
It has the 2nd best win ratio at 63% (but still below the 252 quarterly win ratio of 65%)
It has the smallest average-of-all-gains at 5.37%.
It has the smallest average at .34%.
It has the largest average-of-all-loses at -8.34%.

Digging down into Q3.
The good news. The past 21 years have a 71% win ratio (above the 63-year all quarter win ratio of 60%). When Q2 closed up, Q3 had a 68% win ratio. When Q2 closed above the 12-Month SMA, Q3 had a 69% win ratio. When Q3 closed up, the average-of-all-gains was higher than the 63-Yr Qrtly average. The bad news, when Q3 closed down, the average-of-all-losses was worse than the 63-Yr Qrtly average.

Estimating a projection.
For Q3 (based on historical averages), buyers may want to step in (at or below) 4079 which is also an area of previous resistance. Sellers may want to step out (at or above) 4688, an area about 3% below 2022’s all time high.

Lastly as a word of caution, we’ve closed 16.34% YTD which is just short of the 63-year 16.45% average-of-all-gains. Thus far while not unheard of, given the 2 Fed rate hikes ahead, these current levels are impressive. With just 6 months left in 2023, it will be interesting to see both "if" and "how" these 2 forecasted rate hikes are digested by the markets. The current PE ratio on the S&P 500 is 25.76 (getting pricy) and well above the Mean & Median, so it might be nice to get a pullback this quarter, to keep buyers interested.

