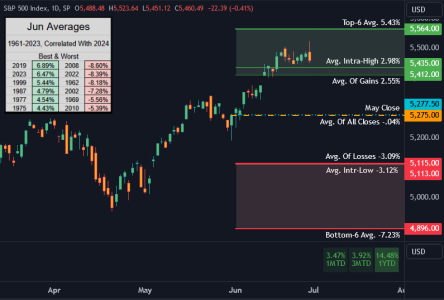
A quick review, closing out the month at 3.47% it was our 14th best of the 64 months of June.
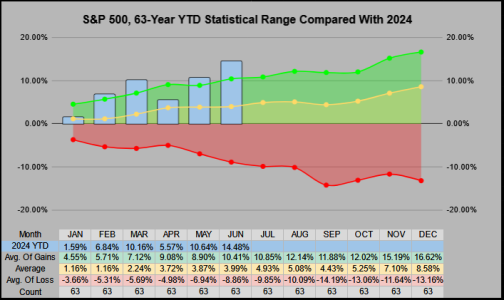
On the YTD scale, this June closed 14.48% YTD, which is the 13th best of 64. Historically speaking, this should put us on target for a 20% to 25% EoY close.
Now for the Month Of July
The 1st Day of July has a 75% win ratio. Since 2011, July's 1st session has closed positive 13 consecutive times.
__Of the 47 times the 1st day closed positive, July had a 62% win ratio.
__Of the 16 times the 1st day closed negative, July had a 31% win ratio.

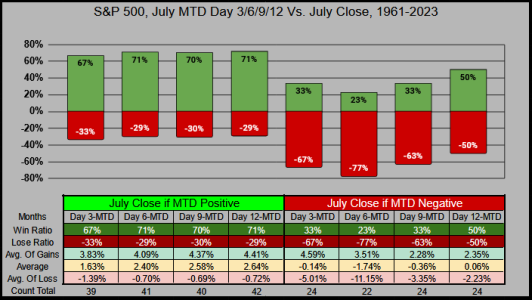
On the Month-To-Date timeframe, the first 3 sessions have a strong correlation to July's close.
__Of the 39 times the 3rd day MTD closed positive, July had a 67% win ratio
__Of the 24 times the 3rd day MTD closed negative, July had a 33% win ratio
On the Monthly scale, the last 21 years of July have been exceptional with a 76% win ratio. The last 9 months of July from 2015-2023 closed positive with an average gain of 3.60%
__
But not everything is rosy:
__Of the 34 times the previous month of June closed positive, July had a 53% win ratio (unusually low).
__Of the 15 Presidential cycles of Year-4, July had a 47% win ratio (a small set of data).
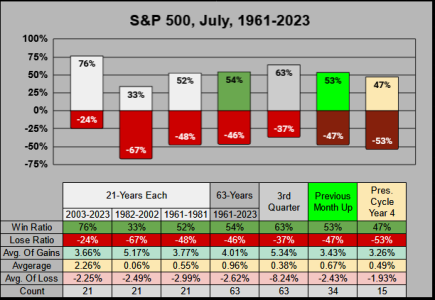
Per the usual, correlating July 2024, with the previous 63-years of July's historical returns.
__Buyers may want to step in at or below the average-of-losses at -2.62% or SPX 5317
__Sellers may want to step out at or above the average-of-gains at 4.01% or SPX 5679
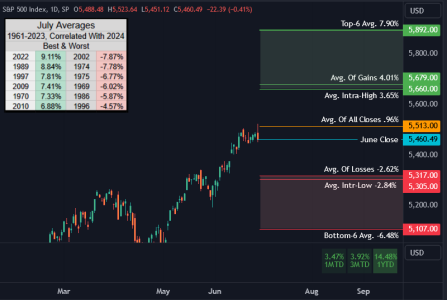
Wrapping this up, based on the statistics presented, here's an estimate for July's close.
If the first 3 sessions look good, then we could look to close the month in the 3.75% to 5.25% range.
If the first 3 sessions look sour, then we could look to close the month in the -2.25% to 1% range.
Thanks for reading & have a great month... Jason

On the YTD scale, this June closed 14.48% YTD, which is the 13th best of 64. Historically speaking, this should put us on target for a 20% to 25% EoY close.

Now for the Month Of July
The 1st Day of July has a 75% win ratio. Since 2011, July's 1st session has closed positive 13 consecutive times.
__Of the 47 times the 1st day closed positive, July had a 62% win ratio.
__Of the 16 times the 1st day closed negative, July had a 31% win ratio.

On the Month-To-Date timeframe, the first 3 sessions have a strong correlation to July's close.
__Of the 39 times the 3rd day MTD closed positive, July had a 67% win ratio
__Of the 24 times the 3rd day MTD closed negative, July had a 33% win ratio

On the Monthly scale, the last 21 years of July have been exceptional with a 76% win ratio. The last 9 months of July from 2015-2023 closed positive with an average gain of 3.60%
__
But not everything is rosy:
__Of the 34 times the previous month of June closed positive, July had a 53% win ratio (unusually low).
__Of the 15 Presidential cycles of Year-4, July had a 47% win ratio (a small set of data).

Per the usual, correlating July 2024, with the previous 63-years of July's historical returns.
__Buyers may want to step in at or below the average-of-losses at -2.62% or SPX 5317
__Sellers may want to step out at or above the average-of-gains at 4.01% or SPX 5679

Wrapping this up, based on the statistics presented, here's an estimate for July's close.
If the first 3 sessions look good, then we could look to close the month in the 3.75% to 5.25% range.
If the first 3 sessions look sour, then we could look to close the month in the -2.25% to 1% range.
Thanks for reading & have a great month... Jason
