I finally had a breakthrough! I always thought the SPY and IWM were a representation of the SP500 and R2K indicies much more so than what they really are. I was very confused when I saw that the all that buying volume in the SPY and IWM and yet the prices went up and down. I figured something was up. When I was thinking about it, I figured that perhaps the SPY just tracks the price movement of the SP500 index but I very quickly concluded that it didn't since when I bought the ETF version of the index before, it affected price.
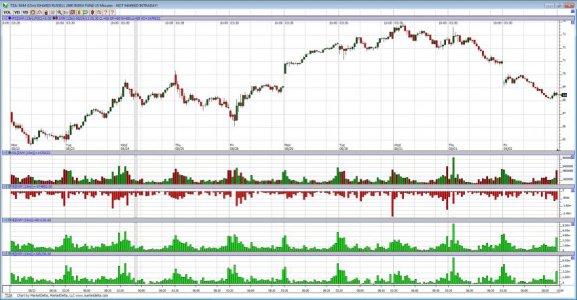
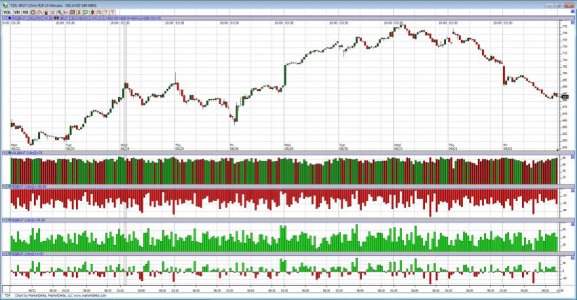
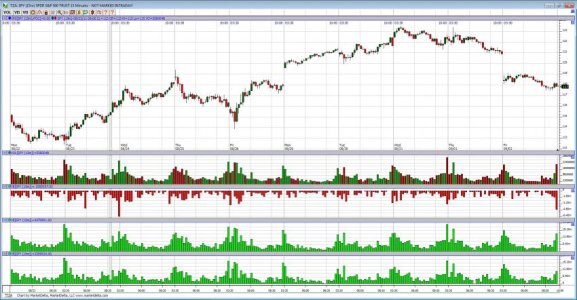
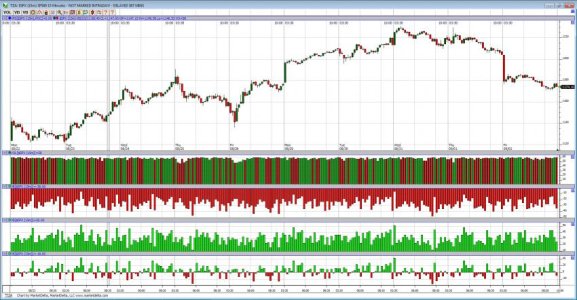
It is my conclusion/theory that the SPY acts as the 501st component of the SP 500 and the IWM acts as the 2001st component of the R2K and thus the SPY/IWM are not true representations of the SP500/R2K indicies. When you buy the SPY, what are you buying? You are buying 1/500th of every company in the SP500 index. I always based my support/resistance levels off the ETF's and not the indicies which is okay since people still have to buy into the ETF to trade the index but not ideal. To know true support/resistance levels it would be ideal to track the actual index. Perhaps most of you knew this already, but I had no idea. I then got the actual indicies to comapre which confirmed my analysis. Thus, I may spend $280 a month to track them in real time.....(because there could be a GIANT voulme spike on SPY for instance and the price shoots up, then out of nowhere, the price starts plumetting!!! How could this be? Since the SPY is just a component 1 out of 501 components, there were massive selling in the other components/companies but you wouldn't know since you are tracking the SPY and not the index)! I attached the graphs below of the SPY, SP500 index, IWM, and Russell 2000 index which confirms my analysis. Notice the massive buying in the ETF index trackers and the opposite in areas of the indicies themselves:
Example: On the SPY, there was massive buying at close, but in reality, the S&P 500 index had selling at close.....
The top 2 graphs are the R2K, and the bottom 2 are the SP500 (ETF price tracker, not true representation of indicies are on the left side, while actual indicies on the right)


