sniper's Account Talk

and just like that, stopped out, sheesh. 1.5% gain.

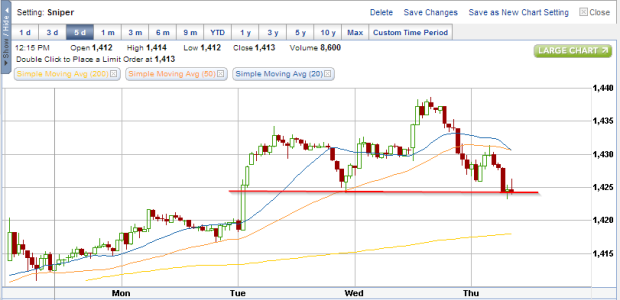
don't like the intraday activity one bit, shooting star on SPX. on the bright side, previous highs were taken out on most major indexes, I don't think the next pullback will be anything like the last one.

Waiting again for the next buy opp, leaning more bullish in the intermediate term

Yep, me too. I got stopped out of 2, EDC and GASL. Still holding TECL, JVA, and GILD. Ill probably get stopped out of those soon too.
 
Yep, me too. I got stopped out of 2, EDC and GASL. Still holding TECL, JVA, and GILD. Ill probably get stopped out of those soon too.

bummer, hopefully you ended the trades in the green. although today's intraday move was disappointing, it allowed me to raise my stop and take a profit instead of a break-even or loss. the shooting star + touch'n'go on the 80 range (full stochastics) doesn't look good, might be seeing a couple pullback days (or sideways action?) before the next up move.

but like i said before, who knows, news is driving the market. might as well be rolling dice at this point :D
 
I bought a chunk of TZA in after hours expecting a pullback for a couple of days. My TSP is still fully invested, but all is well. :)
 
I bought a chunk of TZA in after hours expecting a pullback for a couple of days. My TSP is still fully invested, but all is well. :)

I am eyeing TZA as well as SPXS. My entry for TZA is above 14.81 and an entry for SPXS would be above 17.24, but I would feel good about either one. The market might move sideways or down a bit unless there is cliff news.
 
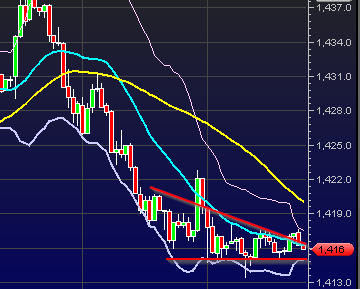
15min SPX chart, not the most robust H&S pattern, but still looks like it could be trouble if that 1423ish level gives way

12-13 SPX 15m.png
 
Aren't short term H&S patterns continuation patterns? I'm hoping this double bottom where resistance becomes support works.:confused: Have a coin?:D

I thought they were generally topping patterns. no pattern is 100% anyway so your guess is as good as mine haha. In this market I honestly have no idea what the heck is going on (I know markets are generally news driven, but this one is to an extreme). I'm just trading according to my system and letting the cards fall, this is one weird market.

technicals aren't looking hot for a short term upside to the market, but we're one obama/boehner speech away from a fiscal cliff agreement to a +300 day from the dow lol

Yes we are. I was just hoping for it to hold here or at the 5 day to get below a 5% loss this year.
 
Well, my brokerage account is loving this move (SPXS), but my TSP account is all like "ow, ow, ow! damn son, chill!"
 
My TZA shares are doing well too! Bought them at 14.71 yesterday and currently sitting at 15.09 (2.93% increase).
 
My TZA shares are doing well too! Bought them at 14.71 yesterday and currently sitting at 15.09 (2.93% increase).

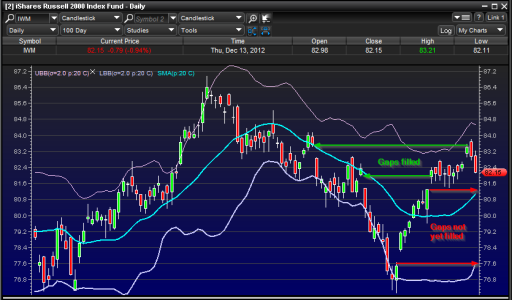
nice! yeah I was thinking about TZA as well, come to think of it, it has a lot of potential. IWM has a couple gaps to fill below. I went with shorting SPX because that was a pretty strong shooting star candle, along with full stochastics failing to stay above 80

below is the open gaps of the russell 2000

12-13 IWM.png
 
Invesopedia defines H&S formations as "trend reversal patterns" but like you said, who can ever really tell in this market. Find what works and stick with it.
I thought the inverted H&S was the change trend and todays move is just going for the head test. This can happen with a deal or maybe when 4th quarter earnings come out. So do we sell for the head test or ride it out???:confused:
 
I really hope (for my TSP) it doesnt go any lower, but I am afraid we are going to see accelerated selling going into the close. The weekly S&P chart looks NASTY!!

pullback is to be expected after so many green days in a row, it may even sting a bit, but I'm looking long term. I believe the fiscal cliff will get resolved (not without some drama & kicking and screaming from both sides first), and 4th quarter earnings reports rarely disappoint.

but i do agree from a technical standpoint, the weeklies are not looking good. wins in the brokerage account if the SPX does take a dive should cushion the blow some
 
Back
Top