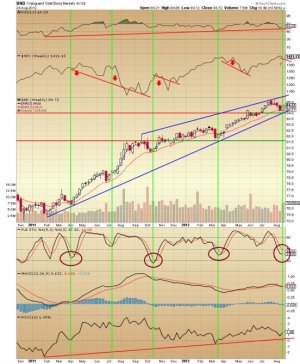
Well yeah, there could be a problem for equities coming about soon. The relevant chart is the Vanguard Total Bond Market (BND) in the weekly timeframe, as viewed below. The bond market is huge and is well known to have a fairly consistent inverse relationship with equities. At first glance the chart may look pretty busy, but let’s review it. First of all, notice that when the stochastic is oversold (first panel beneath the chart), the bond market rallies in subsequent weeks, while equities (in this case SPX) struggles and heads down (first panel above the chart). The stochastic on this weekly chart does not have to get that oversold; as the 35 area was the bottom in March-April. On the candlestick chart we see a rising wedge, with support going back to February 2011 on the lower blue trend line. Last week this line was tested and a rally resulted. So support is intact. Also notice that there is horizontal support (the line is green indicating support and red indicating resistance). Relative Strength Index (RSI) is now heading up off the red trendline, and ROC (Rate of Change) is heading up and is even stronger because it did not even fall to it’s corresponding red rising trendline.
Recently the stochastic has slowed descent and may be bottoming with a turn up due. In previous cases where the stochastic bottomed (follow the vertical green line up) SPX kept rising initially with the bond market and then reversed down. I have no reason to expect it will be different this time. So, a little rally is possibly left, and then “poof” a miserable mid-September and perhaps into October for equities. At least, that is how I interpret this chart.

Recently the stochastic has slowed descent and may be bottoming with a turn up due. In previous cases where the stochastic bottomed (follow the vertical green line up) SPX kept rising initially with the bond market and then reversed down. I have no reason to expect it will be different this time. So, a little rally is possibly left, and then “poof” a miserable mid-September and perhaps into October for equities. At least, that is how I interpret this chart.

