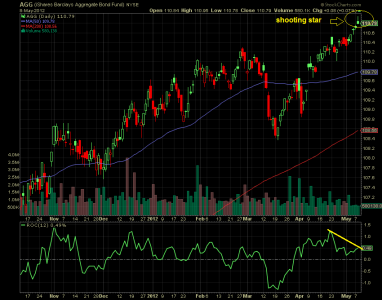
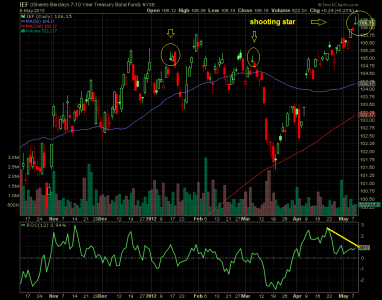
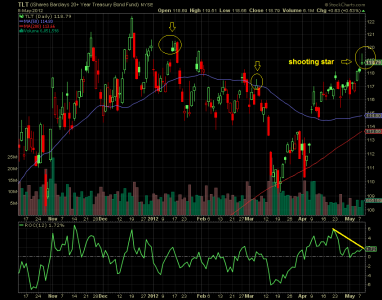
Shooting stars appeared all over the bond charts today as shown below (AGG, IEF and TLT). AGG is Barclays Aggregate Bond Fund, and tracks the TSP F fund pretty well. IEF is Barclays 7-10 year Treasury Bond Fund. TLT is Barclays 20+ year Treasury Bond Fund. A shooting star is a one day reversal pattern. The candlestick (white or black) has a long upper shadow, and preferably no lower shadow, or very little. There is more probability for a reversal the following day if the star gaps up. Shooting stars normally appear at the end of an uptrend. A gap down the next day would confirm a bearish reversal.
I have marked todays and previous occurrences of these shooting stars on the charts; where you can see sell-off in the days following the appearance. Strong gaps and long upper shadows were particularly apparent on IEF and TLT. So now we will look for a reversal in the F fund.


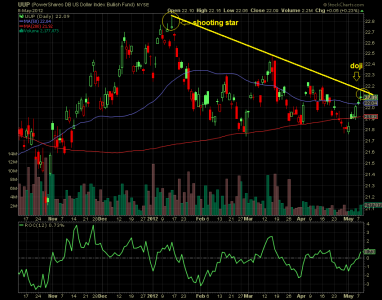
In the bigger picture, an F fund reversal and a US dollar reversal would support equities in the short term. The US dollar bumped up against resistance today on the US Dollar Index Bullish Fund (UUP) as seen on the chart below. The doji candlestick infers indecision. And there is overhead resistance as a descending triangle. Also the Euro looks like it wants to rally. So, I would not be at all surprised to see a shot back up to the 1286 resistance area on SPX, in the coming days; even if the market ultimately traces lower.

I have marked todays and previous occurrences of these shooting stars on the charts; where you can see sell-off in the days following the appearance. Strong gaps and long upper shadows were particularly apparent on IEF and TLT. So now we will look for a reversal in the F fund.


In the bigger picture, an F fund reversal and a US dollar reversal would support equities in the short term. The US dollar bumped up against resistance today on the US Dollar Index Bullish Fund (UUP) as seen on the chart below. The doji candlestick infers indecision. And there is overhead resistance as a descending triangle. Also the Euro looks like it wants to rally. So, I would not be at all surprised to see a shot back up to the 1286 resistance area on SPX, in the coming days; even if the market ultimately traces lower.

