You ever watch a TV show and the entire episode just talks about things that happened in previous episodes?
That's what this is.
S&P 500: A Primer For August & September
Statistically, September is the worst performing month of the year, with a 43% win ratio, and the worst average returns of all months. Thus (in times of uncertainty) August is a good month to decide how to be positioned for September.
Why?
The September low to the Dec close has a 90% win ratio, with an average-of-gains of 9.18%. Not that this is easy, but in theory if we could correctly time the Sep low (historically) we have a 90% chance of a 9.18% gain or a 10% chance of a -11.12% loss.
Below is September's close based on the August close. It may surprise you to know when August closes positive, September's stats are weaker.

The Twelve Months
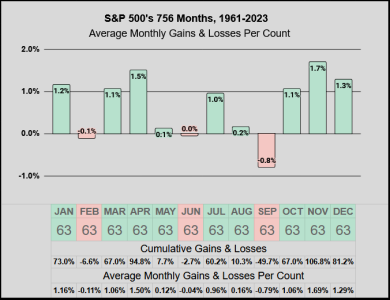
The key takeaway: This next chart is a consolidation of the previous three. Generally speaking, there’s been a universal 63-year-specific truth. The months of Feb, Jun, & Sep might be a good time to take some risk off, particularly if the market's conditions are already not good.

The Four Quarters
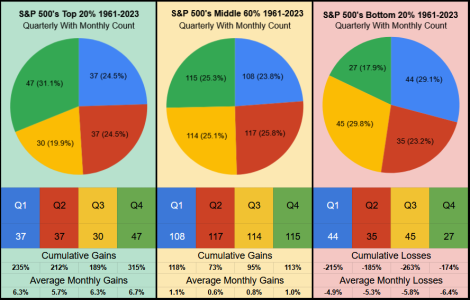
It’s noteworthy, Q3 has the smallest monthly count of the Top 20%, the 2nd smallest monthly count of the Middle 60%, and the highest monthly count of the Bottom 20%.

That's what this is.
S&P 500: A Primer For August & September
Statistically, September is the worst performing month of the year, with a 43% win ratio, and the worst average returns of all months. Thus (in times of uncertainty) August is a good month to decide how to be positioned for September.
Why?
The September low to the Dec close has a 90% win ratio, with an average-of-gains of 9.18%. Not that this is easy, but in theory if we could correctly time the Sep low (historically) we have a 90% chance of a 9.18% gain or a 10% chance of a -11.12% loss.
Below is September's close based on the August close. It may surprise you to know when August closes positive, September's stats are weaker.

The Twelve Months
The key takeaway: This next chart is a consolidation of the previous three. Generally speaking, there’s been a universal 63-year-specific truth. The months of Feb, Jun, & Sep might be a good time to take some risk off, particularly if the market's conditions are already not good.

The Four Quarters
It’s noteworthy, Q3 has the smallest monthly count of the Top 20%, the 2nd smallest monthly count of the Middle 60%, and the highest monthly count of the Bottom 20%.


