Last week, the Top 50 got more bearish, dropping their collective stock exposure by 16.4%. The market declined week over week by 1.83% for the S fund and 1.3% for the C fund. So the bearish shift for the Top 50 was a winner. That's 3 out of the last 4 weeks they've been correct. Unfortunately, they have not been nearly so accurate over the course of the current year.
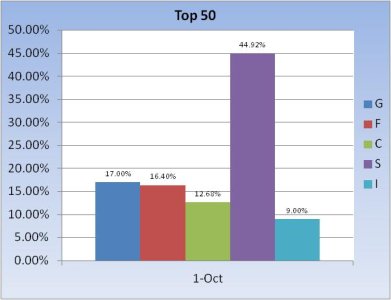
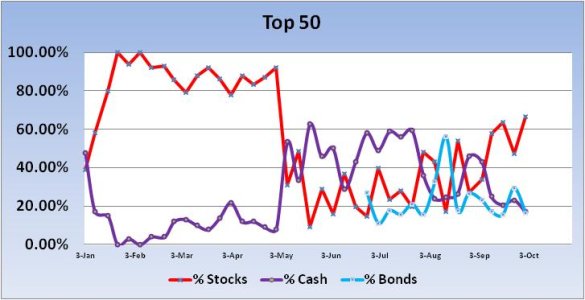
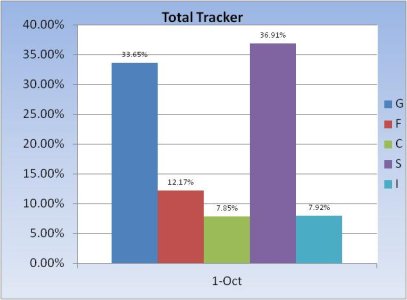
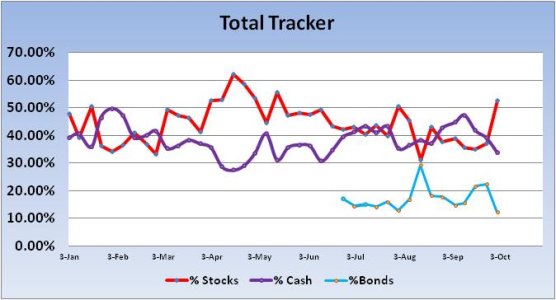
This week, the Top 50 has increased their collective stock exposure by a healthy 19.2%. The Total Tracker also shows a bullish shift as they've increased their stock exposure by 15.67%.
So we bought the dips last week. The question now is whether we'll be rewarded. This data suggests we've got more weakness coming.
Here's the charts:


We can see the big jump in stock exposure with a corresponding drop in cash and bonds in these charts.


Same for the Total Tracker.
Our sentiment survey remained on a buy, but with only two weekly sell signals all year long it's hardly a given that we'll be up for the week based on this reading.
I think there were many of us who were left behind during the bullish run in September and we are now taking advantage of the recent weakness to get back in. Conventional wisdom says the Fed has our backs and that it's an election year, therefore we should see strength in the weeks ahead. Perhaps. But that doesn't mean we can't get another shot lower to shake as many bulls off the bus as possible before turning it back up. The coming week appears pivotal to me because the election is only about a month away. So if we really are going to rally into the election, time is running out to raise bearish levels first. Assuming that's the game plan of course.
This week, the Top 50 has increased their collective stock exposure by a healthy 19.2%. The Total Tracker also shows a bullish shift as they've increased their stock exposure by 15.67%.
So we bought the dips last week. The question now is whether we'll be rewarded. This data suggests we've got more weakness coming.
Here's the charts:


We can see the big jump in stock exposure with a corresponding drop in cash and bonds in these charts.


Same for the Total Tracker.
Our sentiment survey remained on a buy, but with only two weekly sell signals all year long it's hardly a given that we'll be up for the week based on this reading.
I think there were many of us who were left behind during the bullish run in September and we are now taking advantage of the recent weakness to get back in. Conventional wisdom says the Fed has our backs and that it's an election year, therefore we should see strength in the weeks ahead. Perhaps. But that doesn't mean we can't get another shot lower to shake as many bulls off the bus as possible before turning it back up. The coming week appears pivotal to me because the election is only about a month away. So if we really are going to rally into the election, time is running out to raise bearish levels first. Assuming that's the game plan of course.
