The charts for both the Top 50 and the Total Tracker showed stock allocations fall by more than 10% during the market's rally last week. Both groups are now under the 50% mark in total allocations too. Here's the charts:
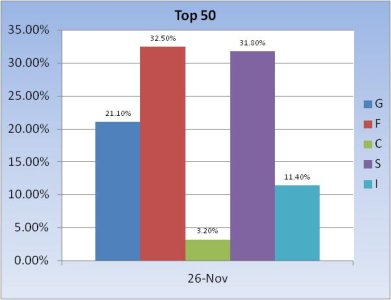
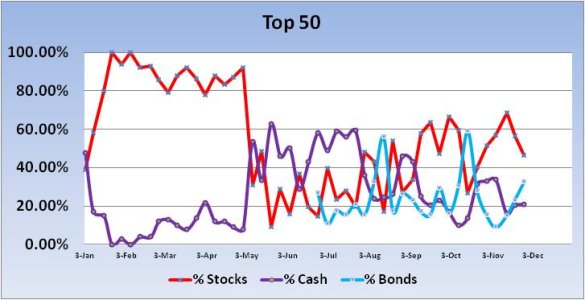
We can see the drop in stock allocations for two weeks now, with a corresponding rise in bond and cash allocations.
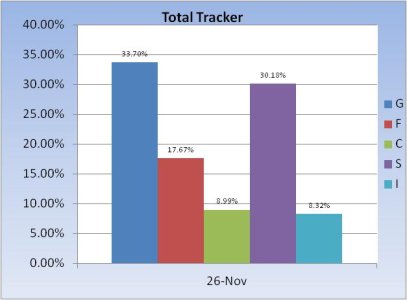
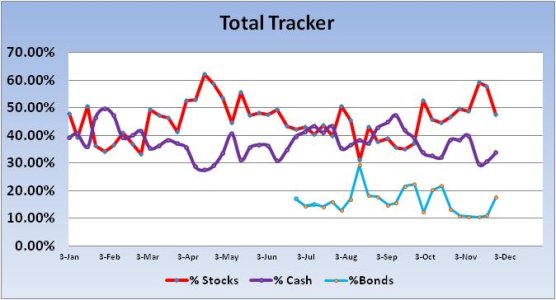
Much the same story for the Total Tracker.
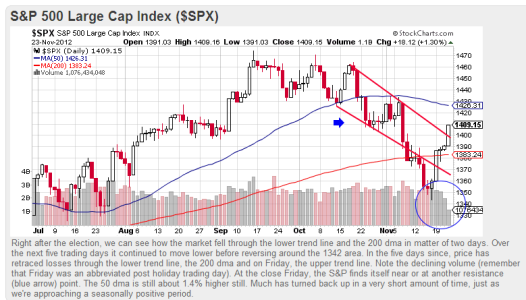
Given our stock allocations, we can't be accused of being overly bullish in spite of the recent rally. This week's sentiment survey saw 47% bulls to 42% bears, which kept the system on a buy. Still, I'd think that's enough bulls after the big run we're had to anticipated at least some measure of a pullback next week, even if the market manages to finish higher by Friday. The trend now appears to be up, so pullbacks may get bought.


We can see the drop in stock allocations for two weeks now, with a corresponding rise in bond and cash allocations.


Much the same story for the Total Tracker.

Given our stock allocations, we can't be accused of being overly bullish in spite of the recent rally. This week's sentiment survey saw 47% bulls to 42% bears, which kept the system on a buy. Still, I'd think that's enough bulls after the big run we're had to anticipated at least some measure of a pullback next week, even if the market manages to finish higher by Friday. The trend now appears to be up, so pullbacks may get bought.
