Last week's Top 50 buy signal was a winner. It didn't look good early on last week given Monday's follow through downside action, but the major indexes posted some nice weekly gains as sentiment got overly bearish. We've seen that happen before.
Here's this week's charts:
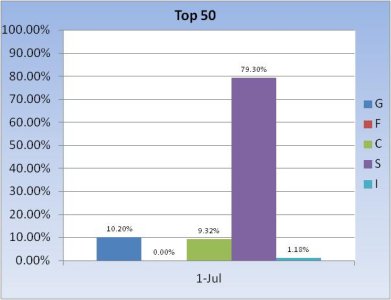
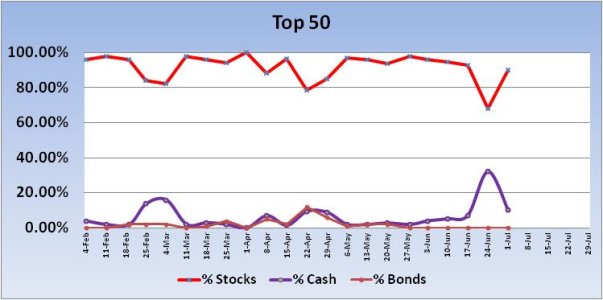
The Top 50 increased their collective stock exposure by 22% going into the new week, which is a sell signal. But these sell signals have not been profitable so far this year. Couple that with a significant decrease in stock allocations across the Total Tracker and I'm leaning bullish for next week.
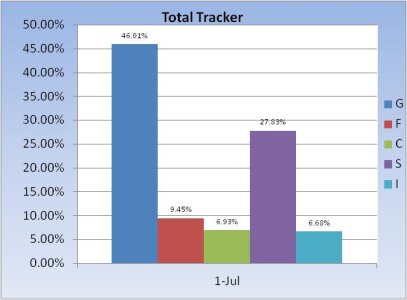
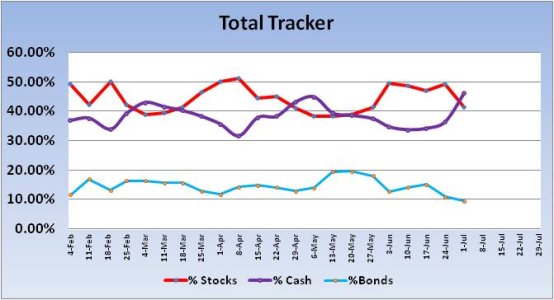
The Total Tracker saw stock allocations fall by 7.87%, which is very close to a buy signal (8% is the trigger). I'm thinking this is close enough not to ignore. Total allocations are also getting much closer to that 40% level, which if allocations fell below it, would be bullish. But we're not quite there yet.
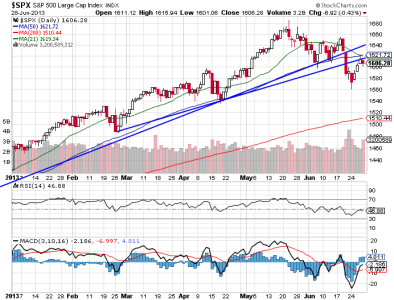
I've drawn two trend lines on this week's S&P 500 chart. One is a longer term trend line going back to November of 2012, and the other from late February to present. Both lines represent resistance between the 1620 and 1640 area. In between those lines is the 50 and 21 day moving averages. The S&P has not been able to close above either the lower trend line or the 50 dma in several trading days. RSI is a bit weak as is MACD. Unless price can break above resistance, preferably on volume, I am not ready to get too excited about the upside. After all, we've been seeing lower highs and lower lows since Mid May.
So while I view the Total Tracker's drop in stock allocations as bullish for next week, the chart of the S&P says to be wary as we're hitting resistance. But there's plenty of wiggle room between those two resistance lines, so more upside is certainly possible. Plus, the next couple of weeks tend to have a positive seasonal bias. But that's the short term. The longer term is still on a sell.
To see this week's full analysis, follow this link TSP Talk Members' Home Page.
Here's this week's charts:


The Top 50 increased their collective stock exposure by 22% going into the new week, which is a sell signal. But these sell signals have not been profitable so far this year. Couple that with a significant decrease in stock allocations across the Total Tracker and I'm leaning bullish for next week.


The Total Tracker saw stock allocations fall by 7.87%, which is very close to a buy signal (8% is the trigger). I'm thinking this is close enough not to ignore. Total allocations are also getting much closer to that 40% level, which if allocations fell below it, would be bullish. But we're not quite there yet.

I've drawn two trend lines on this week's S&P 500 chart. One is a longer term trend line going back to November of 2012, and the other from late February to present. Both lines represent resistance between the 1620 and 1640 area. In between those lines is the 50 and 21 day moving averages. The S&P has not been able to close above either the lower trend line or the 50 dma in several trading days. RSI is a bit weak as is MACD. Unless price can break above resistance, preferably on volume, I am not ready to get too excited about the upside. After all, we've been seeing lower highs and lower lows since Mid May.
So while I view the Total Tracker's drop in stock allocations as bullish for next week, the chart of the S&P says to be wary as we're hitting resistance. But there's plenty of wiggle room between those two resistance lines, so more upside is certainly possible. Plus, the next couple of weeks tend to have a positive seasonal bias. But that's the short term. The longer term is still on a sell.
To see this week's full analysis, follow this link TSP Talk Members' Home Page.
