Scary Chart

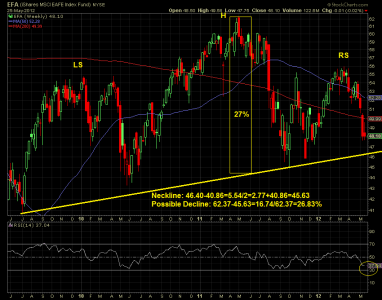
:)The weekly chart of the EFA (iShares MSCI EAFE Index Fund), representing the TSP’s I fund, is shown below. You can see an obvious head & shoulders pattern and a rising neckline. The neckline spans almost three years, from July 2009 to the present. The right shoulder has really taken shape in the last month with the steep decline. Will the neckline be tested, and will it hold in the coming weeks? The RSI is currently at 37.04 and not oversold by any means. We will need to monitor this chart carefully, because calculations indicate that if this sloping neckline breaks, s a 27% decline is possible to a target of approximately 28.89. A 28.54 low was last seen on March 01, 2003. This is one scary chart, and no doubt would sink US markets. As the European crisis deteriorates or gets mended, we will learn more. Until then, this chart is giving us a strong warning to be cautious.

EFA_Scare.png
 
This weekly close was at 46.55, just 0.02 above the low, for a loss of 1.55 (-3.22%). A closer examination of the neckline in the chart above near this weekly close, show that it is not far below near 46.13 v 46.40. This is just -0.42 away or -0.91%. This is the testing area that needs to hold to avert a disaster. Today's candlestick indicates indecision, while the weekly suggests that the selling is not over.
 
Back
Top