Just a brief update on the S&P 500's status over the past 63-Sessions (or 13-Weeks).
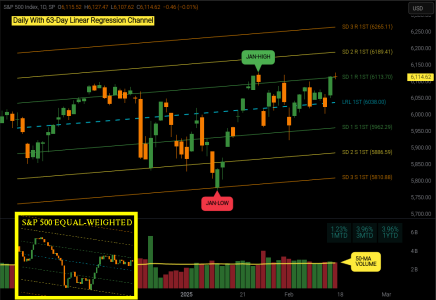
The 63-Session Linear Regression Channel is still rising, price closed just above SD 1 R 1st (Standard Deviation 1 Resistance) this is the area where 67% of prices are expected to reside within. At these levels I'd use the term "Slightly Overbought".
The lower left yellow-boxed chart shows the S&P 500's Equal Weighted Index is declining.

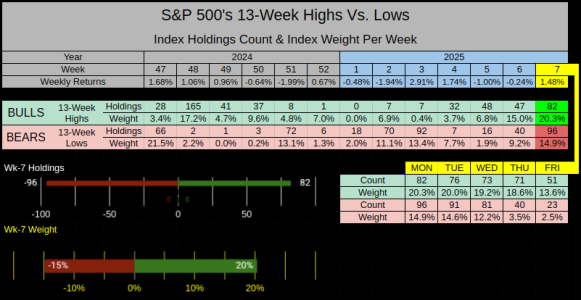
Week-7 Closed positive, but it wasn't a barn-burner.
There were 82 new 13-Week Highs weighted at 20.3% of the Index, Vs. 96 new 13-Week Lows weighted at 14.9% of the index.
So the Bulls control the weighted index, but the bears control the number of holdings.
For week-7 this data captured 35% of the index and it was fairly evenly matched. What we are looking for is an imbalance of power, where one side is overweight and we have a proverbial "flipping of the boat", An example would be week-3 (the January bottom), which had a 2.91% weekly gain.
For Week-3 we can see the Bears dominated with 92 holdings & 13.4% weight, Vs, the Bull's 7 holdings & 0.4% weight.
While this can be an indication of a bottom, this doesn't work in all cases, probably less so in a bull market.

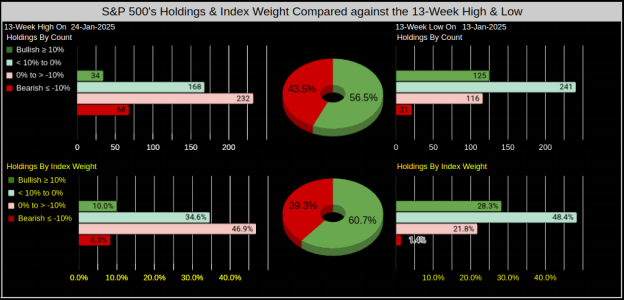
Another way to measure 13-Week High/Lows is to compare the performance of the holdings against the index on the dates the index last made a 13-Week High/Low.
The S&P 500's last 13-Week High was on 24-Jan 2025.
The upper left chart shows us 34 holdings have closed ≥ 10% higher than the high they made on 24-Jan.
The lower left chart shows us those 34 holdings are weighted at 10% of the index.
The pie charts are a consolidation of the high/low data, the Bulls control 56.5% of holdings and 60.7% of the index weight.
Since we are in a clearly defined bull market, I would estimate the primary focus should be on the bearish numbers, which (at this time) are fairly low.

Lastly, I'll focus on last Friday's Trading Day 10 where we closed 1.23% MTD.
From the previous 63-Years of 756 Trading day 10s, when Day-10 was positive MTD:
The monthly win ratio was 80%, with an average gain of 3.76%
The monthly lose ratio was 20% with an average loss of -2.09%

Have a great week....Jason
The 63-Session Linear Regression Channel is still rising, price closed just above SD 1 R 1st (Standard Deviation 1 Resistance) this is the area where 67% of prices are expected to reside within. At these levels I'd use the term "Slightly Overbought".
The lower left yellow-boxed chart shows the S&P 500's Equal Weighted Index is declining.

Week-7 Closed positive, but it wasn't a barn-burner.
There were 82 new 13-Week Highs weighted at 20.3% of the Index, Vs. 96 new 13-Week Lows weighted at 14.9% of the index.
So the Bulls control the weighted index, but the bears control the number of holdings.
For week-7 this data captured 35% of the index and it was fairly evenly matched. What we are looking for is an imbalance of power, where one side is overweight and we have a proverbial "flipping of the boat", An example would be week-3 (the January bottom), which had a 2.91% weekly gain.
For Week-3 we can see the Bears dominated with 92 holdings & 13.4% weight, Vs, the Bull's 7 holdings & 0.4% weight.
While this can be an indication of a bottom, this doesn't work in all cases, probably less so in a bull market.

Another way to measure 13-Week High/Lows is to compare the performance of the holdings against the index on the dates the index last made a 13-Week High/Low.
The S&P 500's last 13-Week High was on 24-Jan 2025.
The upper left chart shows us 34 holdings have closed ≥ 10% higher than the high they made on 24-Jan.
The lower left chart shows us those 34 holdings are weighted at 10% of the index.
The pie charts are a consolidation of the high/low data, the Bulls control 56.5% of holdings and 60.7% of the index weight.
Since we are in a clearly defined bull market, I would estimate the primary focus should be on the bearish numbers, which (at this time) are fairly low.

Lastly, I'll focus on last Friday's Trading Day 10 where we closed 1.23% MTD.
From the previous 63-Years of 756 Trading day 10s, when Day-10 was positive MTD:
The monthly win ratio was 80%, with an average gain of 3.76%
The monthly lose ratio was 20% with an average loss of -2.09%

Have a great week....Jason
Last edited:
