Greetings
​
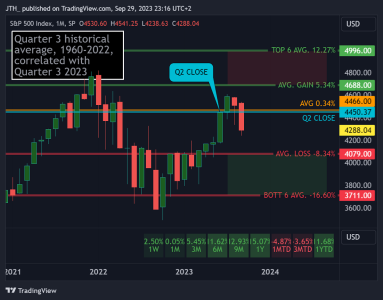
Here's a quick review of the last quarter: Q3 closed down -3.65%, the last time we closed a quarter down was Q3 of 2022. This Q3 2023 ranked as the 46th best of 64, placing it in the bottom 28% of Q3s. The chart below shows where we closed Q3 in relation to its historical percentage closing range.

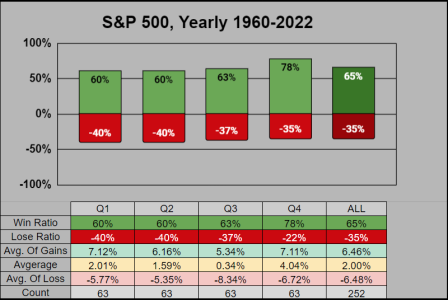
Looking ahead to quarter 4: We have what is historically the best performing of the four quarters. Q4 has a 78% win ratio, the 2nd best average-of-gains at 7.11%, the best total average at 4.04%, and the 3rd best average-of-loses at -6.72%. The chart below shows us the general ranking when compared to the other 3 quarters and all quarters combined.

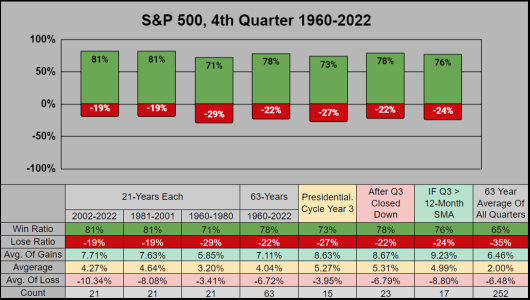
Digging down further into Q4: The chart below shows we have higher (than average) win ratios for all conditions. In particular, the last 21 years have an 81% win ratio and we have a 78% win ratio after Q3 had closed down. Historically speaking, this is as good as it gets.

Here are some random Q4 Stats from 1960-2022:
--- When Q1 & Q2 closed up but Q3 closed down (as with 2023), Q4 had closed up 7 of 8 times.
--- Q4 has an upside bias
------ The best 21 averaged 10.99%
------ The middle 21 averaged 5.17%
------ The worst 21 averaged -4.05%
--- From 252 quarters, 30% of positive quarters were in Q4, with 16% of negative quarters in Q4.
--- The second worst quarter was Q4 1987 @ -23.22%, while the second best quarter was next year's Q4 @ 20.86%.
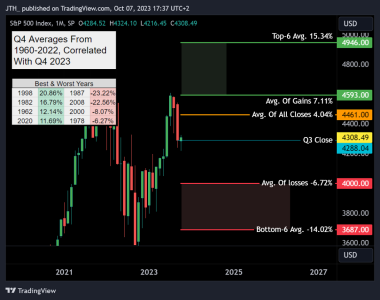
Next Month's Projection based on the previous historical closing range: For Q4 buyers may want to step in (at or below) the average-of-losses at 4000, while sellers may want to step out (at or above) the average-of gains at 4593.

Thanks for reading, have a great month!
​
Here's a quick review of the last quarter: Q3 closed down -3.65%, the last time we closed a quarter down was Q3 of 2022. This Q3 2023 ranked as the 46th best of 64, placing it in the bottom 28% of Q3s. The chart below shows where we closed Q3 in relation to its historical percentage closing range.

Looking ahead to quarter 4: We have what is historically the best performing of the four quarters. Q4 has a 78% win ratio, the 2nd best average-of-gains at 7.11%, the best total average at 4.04%, and the 3rd best average-of-loses at -6.72%. The chart below shows us the general ranking when compared to the other 3 quarters and all quarters combined.

Digging down further into Q4: The chart below shows we have higher (than average) win ratios for all conditions. In particular, the last 21 years have an 81% win ratio and we have a 78% win ratio after Q3 had closed down. Historically speaking, this is as good as it gets.

Here are some random Q4 Stats from 1960-2022:
--- When Q1 & Q2 closed up but Q3 closed down (as with 2023), Q4 had closed up 7 of 8 times.
--- Q4 has an upside bias
------ The best 21 averaged 10.99%
------ The middle 21 averaged 5.17%
------ The worst 21 averaged -4.05%
--- From 252 quarters, 30% of positive quarters were in Q4, with 16% of negative quarters in Q4.
--- The second worst quarter was Q4 1987 @ -23.22%, while the second best quarter was next year's Q4 @ 20.86%.
Next Month's Projection based on the previous historical closing range: For Q4 buyers may want to step in (at or below) the average-of-losses at 4000, while sellers may want to step out (at or above) the average-of gains at 4593.

Thanks for reading, have a great month!
