For 6 out of the last 7 weeks, the direction of shift in total stock exposure by the Top 50 has coincided with the weekly direction of the market. That's in contrast to what amounted to a 25% accuracy rate from January - August 2012. So they've been getting correctly positioned of late.
This week, the Top 50 shows a huge jump in F fund holdings. The week previously, their bond holdings totaled a collective 30.4%. This week that number is 59.2%. Stock allocations fell from 59.6% to a very conservative 26.8%.
The Total Tracker showed little change from last week. Interesting.
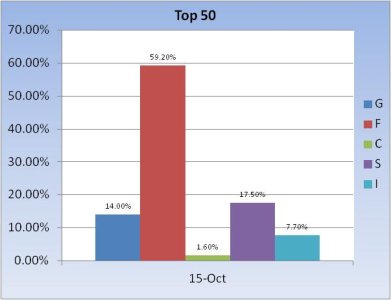
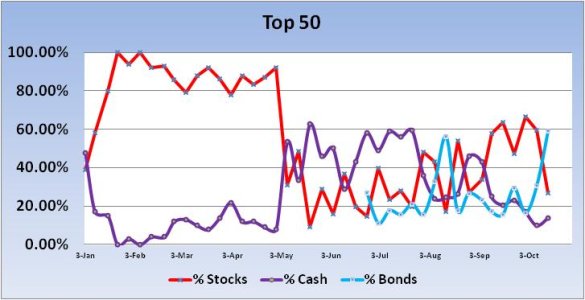
You can see the big ramp up in bond exposure in the charts for the Top 50 this week, with a corresponding plunge in stock holdings.
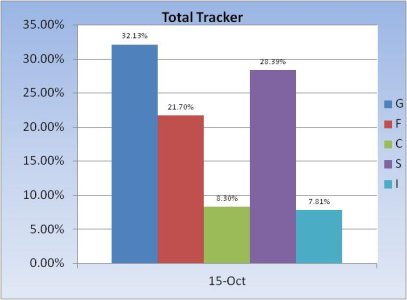
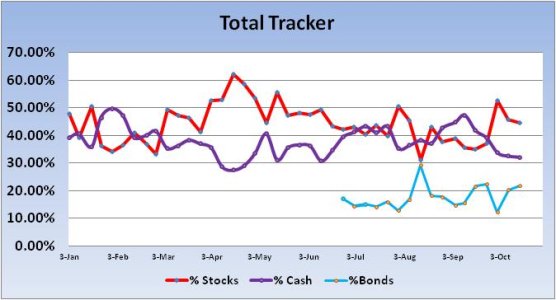
The Total Tracker only saw a modest drop in stock exposure, falling from 45.82% to 44.51%.
So what has the Top 50 spooked? Here's one possible reason:
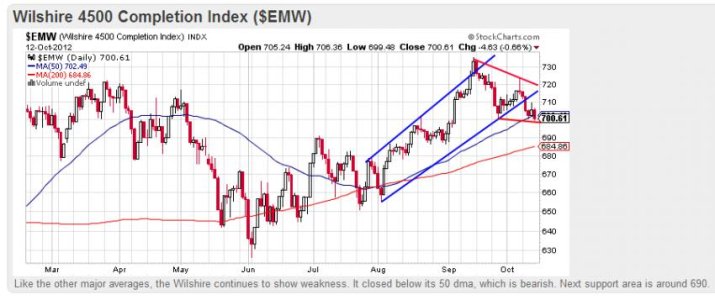
The Wilshire 4500 is representative of our S fund, which has been the fund of choice for stock exposure for many of our TSPers. The fact that it closed below the 50 dma is troubling. I am also a bit concerned that bearish sentiment isn't doing a better job of holding this market up in spite of expanding liquidity.
This week, the Top 50 largely jumped off the bull wagon. And our sentiment survey flipped back to a buy. But it was an even split of bulls to bears and that's not enough for me to hang my hat on in expecting a rally in this market environment. A bounce yes, sustained rally, I have my doubts. At least on this side of the election.
This week, the Top 50 shows a huge jump in F fund holdings. The week previously, their bond holdings totaled a collective 30.4%. This week that number is 59.2%. Stock allocations fell from 59.6% to a very conservative 26.8%.
The Total Tracker showed little change from last week. Interesting.


You can see the big ramp up in bond exposure in the charts for the Top 50 this week, with a corresponding plunge in stock holdings.


The Total Tracker only saw a modest drop in stock exposure, falling from 45.82% to 44.51%.
So what has the Top 50 spooked? Here's one possible reason:

The Wilshire 4500 is representative of our S fund, which has been the fund of choice for stock exposure for many of our TSPers. The fact that it closed below the 50 dma is troubling. I am also a bit concerned that bearish sentiment isn't doing a better job of holding this market up in spite of expanding liquidity.
This week, the Top 50 largely jumped off the bull wagon. And our sentiment survey flipped back to a buy. But it was an even split of bulls to bears and that's not enough for me to hang my hat on in expecting a rally in this market environment. A bounce yes, sustained rally, I have my doubts. At least on this side of the election.
