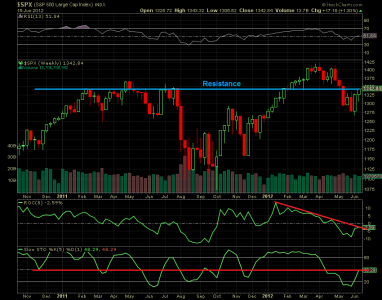
SPX 500 large cap market is within the 1344 resistance zone, being indicated by a blue line on the weekly chart. You can see where this line has alternatively been support or resistance since early 2011. It is currently resistance as the weekly close was 1342.84. This week there will be another test. The market may push above this level, but remember it is where the weekly chart closes that counts. Approximately 1349 would be a 0.236 fibonacci retracement of the 1074.77-1422.38 previous longer term bull market. A resolution above this blue line would be bullish, but below would be bearish. The stock futures made a little pop after the Greece election results, with the New Democracy projected to gain power, but are slipping during the overnight hours. The ROC (rate of change) and Slow Stochastic indicators must cross the red lines; I have drawn, for the advance to continue.


