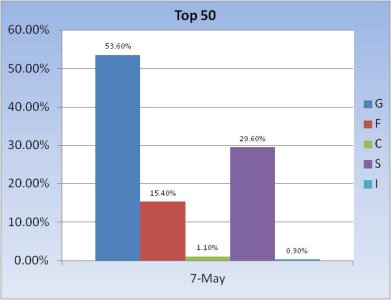
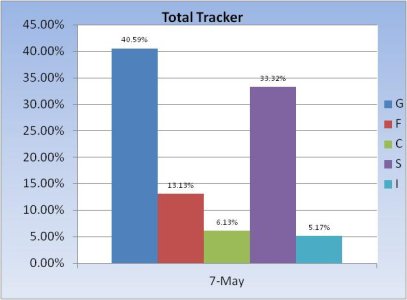
The Top 50 had a huge allocation going into the new trading week. Huge. The Total Tracker also had a sizeable shift, but it's the Top 50 that got my attention. Here's the charts:


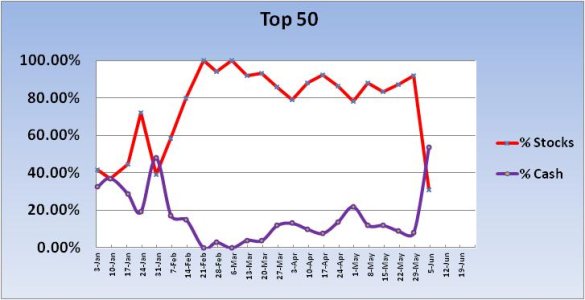
My historical data is limited, but going back to July of 2010 I haven't seen a weekly stock allocation shift anywhere near as large as the one we got this week. For the new week, the Top 50 dropped their collection stock exposure from a wildly bullish 92% to an anemic 31%. That's a 61% drop in just one week!
The biggest drop I had on record was a 39.84% drop in March of 2011. The next one was 27.62% in December of 2011. These are remarkable shifts by themselves, but 61% is a real eye opener.


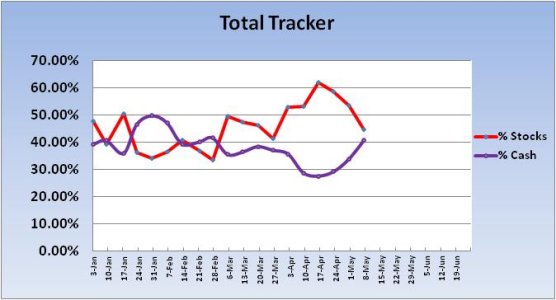
The Total Tracker showed a total stock allocation drop of 8.82% for the new week, falling last week's stock allocation of 53.44% to 44.62% for this week. That's a conservative allocation for this size group, but we had several weeks of lower allocations earlier in the year.
So what can we expect? Our sentiment survey had a lot more bears than bulls, which put that system in a buy condition. The market is also oversold, which means the market "should" see a rally sometime during this coming week.
The Seven Sentinels triggered an "unconfirmed" sell signal last Friday, but NYMO has not hit a 28 day trading low, so the system remains in a buy condition. If market volatility rises in the coming days and weeks, the system could be susceptible to whipsaws. As a precaution, and given our limited capacity to execute trades, it may not be a bad idea to wait on the sidelines in such a market environment. Especially for those who are risk averse.


My historical data is limited, but going back to July of 2010 I haven't seen a weekly stock allocation shift anywhere near as large as the one we got this week. For the new week, the Top 50 dropped their collection stock exposure from a wildly bullish 92% to an anemic 31%. That's a 61% drop in just one week!
The biggest drop I had on record was a 39.84% drop in March of 2011. The next one was 27.62% in December of 2011. These are remarkable shifts by themselves, but 61% is a real eye opener.


The Total Tracker showed a total stock allocation drop of 8.82% for the new week, falling last week's stock allocation of 53.44% to 44.62% for this week. That's a conservative allocation for this size group, but we had several weeks of lower allocations earlier in the year.
So what can we expect? Our sentiment survey had a lot more bears than bulls, which put that system in a buy condition. The market is also oversold, which means the market "should" see a rally sometime during this coming week.
The Seven Sentinels triggered an "unconfirmed" sell signal last Friday, but NYMO has not hit a 28 day trading low, so the system remains in a buy condition. If market volatility rises in the coming days and weeks, the system could be susceptible to whipsaws. As a precaution, and given our limited capacity to execute trades, it may not be a bad idea to wait on the sidelines in such a market environment. Especially for those who are risk averse.
