This week’s sentiment reading is 46% bulls to 42% bears vs. 37% bulls to 54% bears the previous week. That’s more bulls and less bears. This is a modestly bullish reading. But what really has my interest this week is the data from the Auto-Tracker (Total Tracker). Here is this week's charts:
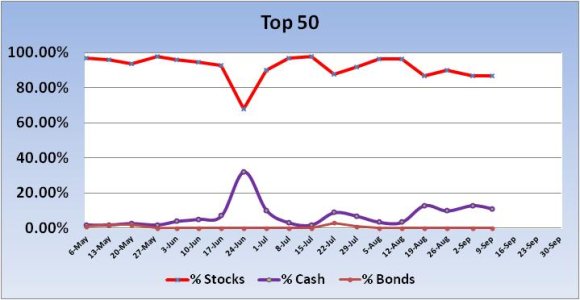
No signal from the Top 50 this week. For the new trading week, total stock allocations dipped by just 0.2% to a total stock allocation of 86.8%.
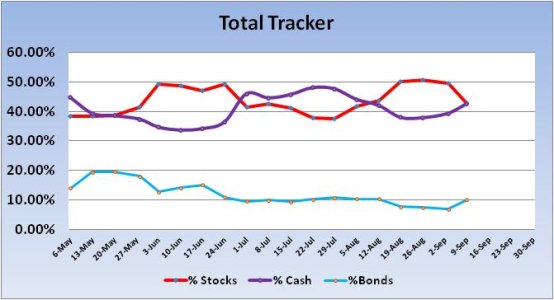
No “official” signal was generated from the Total Tracker this week. But total stock allocations fell relatively significantly in spite of our survey showing more bulls and less bears. So far this year, the odds favor a rally when total stock allocation dip across the Auto Tracker (Total Tracker) in any given week. And this week, they fell by 6.78% to a total stock allocation of 42.76%.
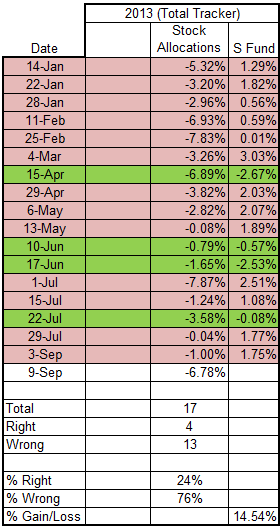
There were seventeen weeks this year when total stock allocations from the auto-tracker fell from the previous week. Out of those seventeen weeks when allocations fell, only four of those weeks did the market actually decline. That is less than a 25% accuracy rate. The total percent gain/loss across those seventeen weeks was 14.54%. So if you were 100% invested in the S fund for just those weeks, you would be up by that amount. This week, the Total Tracker is showing a drop in stock allocations of 6.78%. It is not a lock that the market will rally on these odds. The weeks of April 15th and June 17th saw sizable losses in spite of a dip in stock allocations. Still, taken as a whole I have to respect the chances for a rally this week.
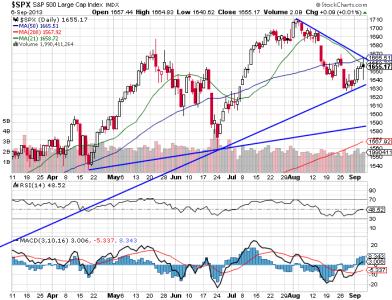
Price continued to rise for the S&P 500 the past week. Trend line support held, but price still has to clear the 50 day moving average (which it tagged on Friday) and downward trend line resistance. The relative strength index is largely neutral, while momentum is turning up. Next week’s action will probably be key as to which way the index is going to break as support and resistance are converging.
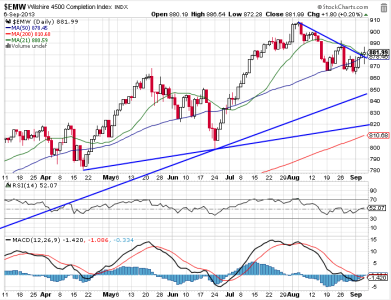
Price on the Wilshire 4500 (equivalent to the S fund) has been finding support around its 50 day moving average and did close above both it and downward trend line resistance on Friday. Momentum remains negative, but it is improving and may have both a positive signal line and center line cross soon. The Relative Strength Index is now positive. This is a bullish chart; especially taken in context with our sentiment survey and Auto-Tracker data.
To see this week's full analysis, follow this link http://www.tsptalk.com/members/

No signal from the Top 50 this week. For the new trading week, total stock allocations dipped by just 0.2% to a total stock allocation of 86.8%.

No “official” signal was generated from the Total Tracker this week. But total stock allocations fell relatively significantly in spite of our survey showing more bulls and less bears. So far this year, the odds favor a rally when total stock allocation dip across the Auto Tracker (Total Tracker) in any given week. And this week, they fell by 6.78% to a total stock allocation of 42.76%.

There were seventeen weeks this year when total stock allocations from the auto-tracker fell from the previous week. Out of those seventeen weeks when allocations fell, only four of those weeks did the market actually decline. That is less than a 25% accuracy rate. The total percent gain/loss across those seventeen weeks was 14.54%. So if you were 100% invested in the S fund for just those weeks, you would be up by that amount. This week, the Total Tracker is showing a drop in stock allocations of 6.78%. It is not a lock that the market will rally on these odds. The weeks of April 15th and June 17th saw sizable losses in spite of a dip in stock allocations. Still, taken as a whole I have to respect the chances for a rally this week.

Price continued to rise for the S&P 500 the past week. Trend line support held, but price still has to clear the 50 day moving average (which it tagged on Friday) and downward trend line resistance. The relative strength index is largely neutral, while momentum is turning up. Next week’s action will probably be key as to which way the index is going to break as support and resistance are converging.

Price on the Wilshire 4500 (equivalent to the S fund) has been finding support around its 50 day moving average and did close above both it and downward trend line resistance on Friday. Momentum remains negative, but it is improving and may have both a positive signal line and center line cross soon. The Relative Strength Index is now positive. This is a bullish chart; especially taken in context with our sentiment survey and Auto-Tracker data.
To see this week's full analysis, follow this link http://www.tsptalk.com/members/
