I haven't been paying much attention to the markets the past two weeks but this is an idea I've been pondering over for a few months now. As I've said before and many probably agree, sentiment is the key to big profits. The problem is, how do you decipher when sentiment is at investable extremes. The sentiment survey and AAII surveys are pretty good starts, but there's hardly one indicator that's right every time. Usually it's a multitude of indicators that lead one to buy or sell at any given time.
Looking back on 2009 compared to 2007-2008 on the MB, I think I've found another indicator to use for sentiment. Maybe one of our mods can figure a way to put numbers to this one but here's what I've found.
In 2007-2008, talk about the market, personal winning market beating systems, trading heroics and enhanced gains by trading stocks and ETF's in personal portfolios accounted for a majority of the posts on the MB. Yet,in 2009, a year where some were able to increase their portfolio by 50-70% in the biggest year since the Roaring 20's, political posts have seemed to take front and center stage on the MB. Why is that? Probably part of it is the 2 IFT's a month, but I account most of it to the tried and true theory of market sentiment. When everyone throws in the towel and calls it quits, the market must always march higher.
Right now, I'm personally watching closely any bullish/bearish comments on Gold and the general market for signs of irrational exuberance. Many posts on Gold were made a month ago when the media was pumping it, but poof, along with that came a short term top. Not many talking about gold now it seems.
Go for yours in 2010. Nobody is going to do it for you. Think with an open mind, turn off CNBC, stop looking at 15 minute charts and capture the big picture.
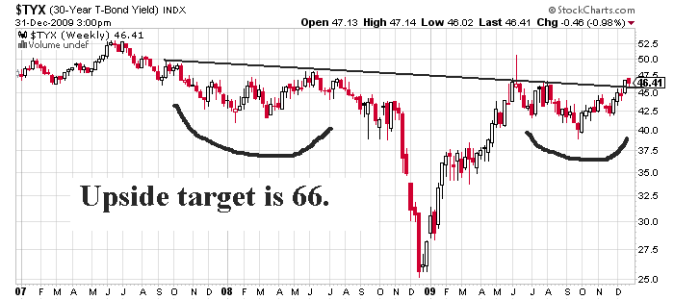
With that, I leave you with my big idea chart theme for 2010. Retail investors have been tripping over their own feet to pile into the bond market in 2009 after being burned in 2008. It's no secret, you can find the fund flows on many sites and blogs online. Is the euphoria in the bond market about to run it's course? Think October 2007 and March 2009 here.

Take care. Happy New Year. Wishing all a healthy, safe, prosperous 2010!
Looking back on 2009 compared to 2007-2008 on the MB, I think I've found another indicator to use for sentiment. Maybe one of our mods can figure a way to put numbers to this one but here's what I've found.
In 2007-2008, talk about the market, personal winning market beating systems, trading heroics and enhanced gains by trading stocks and ETF's in personal portfolios accounted for a majority of the posts on the MB. Yet,in 2009, a year where some were able to increase their portfolio by 50-70% in the biggest year since the Roaring 20's, political posts have seemed to take front and center stage on the MB. Why is that? Probably part of it is the 2 IFT's a month, but I account most of it to the tried and true theory of market sentiment. When everyone throws in the towel and calls it quits, the market must always march higher.
Right now, I'm personally watching closely any bullish/bearish comments on Gold and the general market for signs of irrational exuberance. Many posts on Gold were made a month ago when the media was pumping it, but poof, along with that came a short term top. Not many talking about gold now it seems.
Go for yours in 2010. Nobody is going to do it for you. Think with an open mind, turn off CNBC, stop looking at 15 minute charts and capture the big picture.
With that, I leave you with my big idea chart theme for 2010. Retail investors have been tripping over their own feet to pile into the bond market in 2009 after being burned in 2008. It's no secret, you can find the fund flows on many sites and blogs online. Is the euphoria in the bond market about to run it's course? Think October 2007 and March 2009 here.

Take care. Happy New Year. Wishing all a healthy, safe, prosperous 2010!
