Each week, I post some charts that show how the TSPers on our tracker are positioned going into the new trading week. I show how the Top 50 are positioned and how the entire group (there are 972 participants currently) are positioned. If you are in the Top 50, you are in a very select group. Just a bit over 5% of the total number of participants are in this group. So they must be doing something right, right? Follow the leaders, right?
I've been looking at this years week over week results (January to present) to see how often the Top 50 had correctly shifted their stock exposure with respect to how the market actually performed for that week. In other words, if the Top 50 had a 10% increase in total stock allocation and the market was up for the week, I would view that as getting correctly positioned with the market for that week. If on the other hand the Top 50 increased their stock allocation for the week and the market was down, then the shift in stock allocation for that week was not correct. After reviewing this years data, I was a bit surprised to see that the Top 50 were more of a contrarian indicator than anything else.
So far we've had 34 weeks of trading this year (January - present). The Top 50 correctly shifted their stock allocation only 9 weeks out of those 34 weeks of trading. That means the Top 50 as a group were correct only 26.47% of the time. About 1 out of every 4 weeks.
The Total Tracker over the same time frame was correct 32.35% of the time.
So the shift in stock allocation for either group would seem to be more of a contrarian indicator this year than anything else.
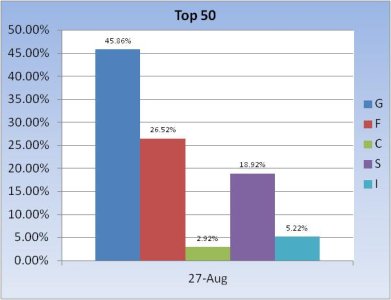
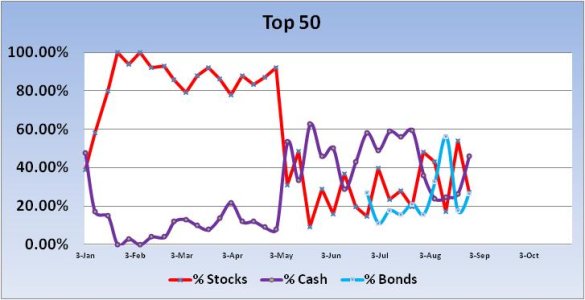
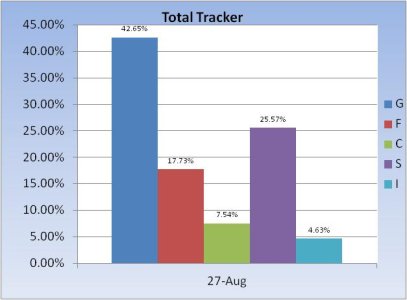
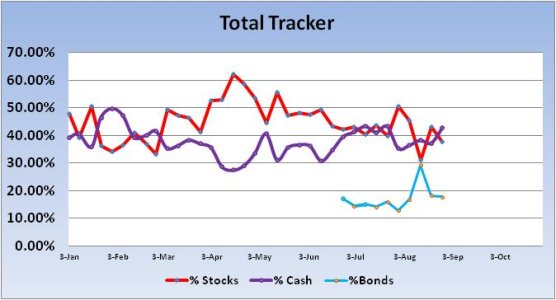
Here's this week's charts:


This week the Top 50 shifted into cash and bonds again as total stock allocations fell 26.88%. Based on this year's week over week performance for this group, that may indicate we'll be seeing some upside this week.


The Total Tracker showed a drop in stock allocations of 5.28% this week. Our total stock allocation for the entire tracker sits at a modest 37.75%.
So the bearish tilt remains. And our sentiment survey hasn't changed either as it remains on a buy.
I've been looking at this years week over week results (January to present) to see how often the Top 50 had correctly shifted their stock exposure with respect to how the market actually performed for that week. In other words, if the Top 50 had a 10% increase in total stock allocation and the market was up for the week, I would view that as getting correctly positioned with the market for that week. If on the other hand the Top 50 increased their stock allocation for the week and the market was down, then the shift in stock allocation for that week was not correct. After reviewing this years data, I was a bit surprised to see that the Top 50 were more of a contrarian indicator than anything else.
So far we've had 34 weeks of trading this year (January - present). The Top 50 correctly shifted their stock allocation only 9 weeks out of those 34 weeks of trading. That means the Top 50 as a group were correct only 26.47% of the time. About 1 out of every 4 weeks.
The Total Tracker over the same time frame was correct 32.35% of the time.
So the shift in stock allocation for either group would seem to be more of a contrarian indicator this year than anything else.
Here's this week's charts:


This week the Top 50 shifted into cash and bonds again as total stock allocations fell 26.88%. Based on this year's week over week performance for this group, that may indicate we'll be seeing some upside this week.


The Total Tracker showed a drop in stock allocations of 5.28% this week. Our total stock allocation for the entire tracker sits at a modest 37.75%.
So the bearish tilt remains. And our sentiment survey hasn't changed either as it remains on a buy.
