Piercing line reversal candle for C fund (S&P 500)

twodaystocks

Market Tracker
Reaction score
3
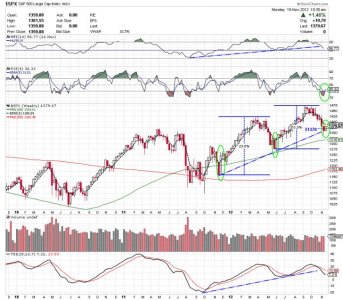
The US stock markets opened higher today, led mostly by hopes for the Fiscal cliff and a 2.1% jump in October home sales. The C fund which matches the S&P 500, looks to be forming a piercing line reversal on the weekly candle. If this follows through, and finishes 50% higher than the base of the previous candle, it is a strong sign of a reversal in the markets. The same candle formed towards the end of 2011 and the markets rallied hard for the next 4 months, gaining over 20%. It also formed towards the end of June and the markets surged over 15%. I am not a buyer yet, but I am watching this chart very closely.
19 Nov 12 C Piercing Line.jpg

I would love to hear other thoughts on this chart and/or the market in general.
 
http://www.cnbc.com/id/49890269/

Nice article on CNBC talking about the Thanksgiving week rally. I don't see it lasting long, but with congress out, and the last news from them being positive, I think some investors could get quick gains. I wouldn't get too relaxed though. I still see a test/retest of the lows, especially until there is a solid resolution to "the cliff."

Thanks for the articles and charts, I appreciate the perspective....What is your take on this "cliff" now being downplayed as a "slope"?

I have tried crunching all the numbers and no matter how I look at it, we're in for a steep drop.
 
Thanks for the articles and charts, I appreciate the perspective....What is your take on this "cliff" now being downplayed as a "slope"?

I have tried crunching all the numbers and no matter how I look at it, we're in for a steep drop.

Cliff/slope.. "would a rose by any other name.." I think if you take away the talking heads on CNBC and just look at the numbers (however reliable those might be) it is still a cliff. The stock market was in serious correction territory, it had broken down out of its trends, through support, money was/is flowing out of the stock, the TSI (true strength index) has fallen through its previous trendline, and I think the CNBC anchors were told to try and give a bit of a more positive spin on it all. The housing numbers were good yesterday and today, which is a good sign, but not good enough for a 200 point rally in the dow, but good enough to inspire confidence. I think this is a "cats away the mouse will play" rally. No negative news from pres. Obama/congress, and little negative news from europe and asia, so to me, this looks like short rally before the holidays and more market/global uncertainty takes over again. I look for a test/retest within the next couple of weeks, given the assumption that no positive "fiscal slope" news comes out. Even though I don't believe this will last, I am testing the waters to see if I can get a quick % or 2.
 
Its nice to hear more positive news regarding housing. I also saw a quick ticker about Pres. Obama and China coming to some sort of an agreement regarding security and possibly trade. Don't quote me, but I think that was the subject. Regardless of the specifics, it's nice to see the S&P only 2 points off yesterday's HOD. I would still feel better to see it move above its 5 EMA, which is only 6 points away.
 
Aside from Chmn Bernanke slapping down the markets for about an hour, US markets showed more strength today. At around noon, the S&P began a long steep slide as chmn Bernanke began speaking, but found support at the 1377 level. From that point on, it was higher highs, and mostly higher lows. The S&P dropped and rallied back over 1% in the afternoon, which I am taking as more signs of strength in this Thanksgiving rally. In a perfect world, I would hope for a quiet night, a strong candle in the overseas markets, and continued strength through the end of this week.

$SPX - SharpCharts Workbench - StockCharts.com Link to today's S&P intraday chart.
 
Just heard another name for the fiscal cliff on CNBC. Analyst called it the Fiscal Abyss. We have gone from a cliff to a slope, now to an abyss?? Whatever the name is, I hope this situation gets resolved QUICK! On the up side, the S&P futures are up slightly.
 
Will the S&P rally into the close or will it sell off? It looks good right now, intraday, but it still seems to be struggling to stay above the 1390/1391 resistance.
 
Weekly Stochastics broke out of the 20 range which is typically bullish for the upcoming weeks, might be a good time to get in.
 
Weekly Stochastics broke out of the 20 range which is typically bullish for the upcoming weeks, might be a good time to get in.

Which stochastics indicator are you referring to? Slow, fast, full, or stochastics RSI? Either way, it's moving higher on the weekly chart, which is good enough for me. Most of the chatter I've heard online, on tv is saying this trend might continue into early Dec. You can never tell I guess.

Fingers crossed.
 
It is nice to see the S&P move past its resistance @ 1390, now if it can move and stay above 1400, that would be a Great sign for bulls.
 
Back
Top