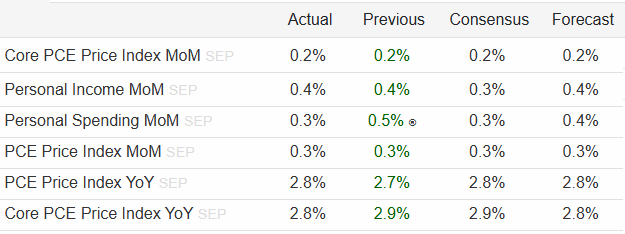
PCE Prices / Personal Income and Spending

Fed’s key inflation gauge rose 2.5% in June from a year ago, easing path to rate cut

The personal consumption expenditures price index increased 0.1% in June and was up 2.5% from a year ago, with the annual rate showing a slight decline from the prior month.
Core inflation, which excludes food and energy, showed a monthly increase of 0.2% and 2.6% on the year, both also in line with expectations.

Personal income rose just 0.2%, below the 0.4% estimate. Spending increased 0.3%, meeting the forecast, while the personal savings rate decreased to 3.4%.

PCE inflation June 2024:
 
US Core PCE Price Index (Y/Y) Aug: 2.7% (est 2.7%; prev 2.6%)

- Core PCE Price Index (M/M) Aug: 0.1% (est 0.2%; prev 0.2%)
- PCE Price Index (Y/Y) Aug: 2.2% (est 2.3%; prev2.5 %)
- PCE Price Index (M/M) Aug: 0.1% (est 0.1%; prev 0.2%)


US Personal Income Aug: 0.2% (est 0.4%; prev 0.3%)

- Personal Spending Aug: 0.2% (est 0.3%; prev 0.5%)
- Real Personal Spending Aug: 0.1% (est 0.1%; prev 0.4%)
 
Key Fed inflation rate hits 2.1% in September, as expected

The personal consumption expenditures price index showed a seasonally adjusted 0.2% increase for the month, with the 12-month inflation rate at 2.1%, both in line with Dow Jones estimates.

However, the core inflation rate was at 2.7% after the measure increased 0.3% on a monthly basis.

Initial filings for unemployment benefits totaled 216,000 for the week ending Oct. 26, a decrease of 12,000 and below the forecast for 230,000.

 
Fed’s preferred inflation gauge rises to 2.3% annually, meeting expectations

The personal consumption expenditures price index, a broad measure that the Fed prefers as its inflation gauge, increased 0.2% on the month and showed a 12-month inflation rate of 2.3%. Both were in line with the Dow Jones consensus forecast, though the annual rate was higher than the 2.1% level in September.

Excluding food and energy, core inflation showed even stronger readings, with the increase at 0.3% on a monthly basis and an annual reading of 2.8%. Both also met expectations. The annual rate was 0.1 percentage point above the prior month.


PCE Prices
Actual: 0.2% | B.com Forecast: 0.2% | Prior: 0.2%

PCE Prices - Core
Actual: 0.3% | B.com Forecast: 0.3% | Prior: 0.3%

Personal Income
Actual: 0.6% | B.com Forecast: 0.3% | Prior: 0.3%

Personal Spending
Actual: 0.4% | B.com Forecast: 0.3% | Prior: 0.6% | Revised From: 0.5%
 
Key Fed inflation measure shows 2.4% rate in November, lower than expected

The PCE price index, the Fed’s preferred inflation gauge, showed an increase of just 0.1% from October and a 2.4% annual rate, both below expectations.

Excluding food and energy, core PCE also increased 0.1% monthly and was 2.8% higher from a year ago, with both readings being 0.1 percentage point below the forecast.

Personal income rose 0.3%, short of the 0.4% estimate. Personal expenditures increased 0.4%, one-tenth of a percentage point below the forecast.

 
Key Fed measure shows core inflation at 2.8%, in line with expectations

The personal consumption expenditures price index increased 2.6% on a year-over-year basis in December, while core PCE was at 2.8%, both in line with expectations but well ahead of the Fed’s 2% target.

Personal income climbed 0.4% as forecast, while spending rose 0.7%.

 
Fed’s favorite core inflation measure hits 2.6% in January, as expected

The personal consumption expenditures price index, the Federal Reserve’s preferred inflation measure, increased 0.3% for the month and showed a 2.5% annual rate.

Excluding food and energy, core PCE also rose 0.3% for the month and was at 2.6% annually. Fed officials more closely follow the core measure as a better indicator of longer-term trends.

Personal income posted rose 0.9% against expectations for a 0.4% increase. However, the higher incomes did not translate into spending, which decreased 0.2%, versus the forecast for a 0.1% gain.

 
Highlights
  • Personal income increased 0.8% month-over-month in February (Briefing.com consensus 0.4%) following a downwardly revised 0.7% increase (from 0.9%) in January.
  • Personal spending rose 0.4% month-over-month (Briefing.com consensus 0.6%) following a downwardly revised 0.3% decline (from -0.2%) in January.
  • The PCE Price Index was up 0.3% month-over-month, as expected, which left it up 2.5% year-over-year, unchanged from January.
  • The core-PCE Price Index jumped 0.4% month-over-month (Briefing.com consensus 0.3%), which left it up 2.8% year-over-year versus an upwardly revised 2.7% (from 2.6%) in January.

PCE Prices For: Feb
Actual: 0.3%
B.com Forecast: 0.3%
B.com Cons: 0.3%
Prior: 0.3%

PCE Prices - Core For: Feb
Actual: 0.4%
B.com Forecast: 0.3%
B.com Cons: 0.4%
Prior: 0.3%

Personal Income For: Feb
Actual: 0.8%
B.com Forecast: 0.3%
B.com Cons: 0.4%
Prior: 0.7%
Revised From: 0.9%

Personal Spending For: Feb
Actual: 0.4%
B.com Forecast: 0.7%
B.com Cons: 0.6%
Prior: -0.3%
Revised From: -0.2%

Source:
 
Personal Income
Actual: 0.5%
B.com Forecast: 0.5%
B.com Cons: 0.4%
Prior: 0.7%
Revised From: 0.8%

Personal Spending
Actual: 0.7%
B.com Forecast: 0.4%
B.com Cons: 0.4%
Prior: 0.5%
Revised From: 0.4%

PCE Prices
Actual: 0.0%
B.com Forecast: 0.0%
B.com Cons: 0.0%
Prior: 0.5%
Revised From: 0.3%

PCE Prices - Core
Actual: 0.0%
B.com Forecast: 0.0%
B.com Cons: 0.1%
Prior: 0.5%
Revised From: 0.4%

Highlights
  • Personal income increased 0.5% month-over-month in March (Briefing.com consensus 0.4%) after increasing a revised 0.7% (from 0.8%) in February.
  • Personal spending rose 0.7% month-over-month (Briefing.com consensus 0.4%) after increasing a revised 0.5% (from 0.4%) in February.
  • The PCE Price Index was unchanged month-over-month (Briefing.com consensus 0.0%), which left it up 2.3% year-over-year versus a revised 2.7% (from 2.5%) in February.
  • The core-PCE Price Index was also unchanged month-over-month (Briefing.com consensus 0.1%), which left it up 2.6% year-over-year versus a revised 3.0% (from 2.8%) in February.
Key Factors
  • The PCE Price Index for Goods was down 0.5% month-over-month and down 0.3% year-over-year versus up 0.4% in February.
  • The PCE Price Index for Services was up 0.2% month-over-month, leaving it up 3.5% year-over-year versus 3.8% in February.
  • Wages and salaries increased 0.5% month-over-month after increasing 0.4% in February.
  • Rental income increased 0.7% month-over-month after increasing 0.8% in February.
  • Personal interest income rose 0.4% month-over-month for the second consecutive month. Personal dividend income was also up 0.4% month-over-month after increasing 0.3% in February.
  • Real disposable income was up 0.5% month-over-month and was up 1.7% year-over-year. Real personal spending increased 0.7% month-over-month and was up 3.3% year-over-year.
  • The personal savings rate, as a percentage of disposable personal income, decreased to 3.9% from 4.1%.
Big Picture
  • The key takeaway from the report is that it showed an acceleration in spending as consumers prepared for the implementation of tariffs. The PCE Price Index decelerated to 2.3% year-over-year from 2.7% while the core PCE Price Index decelerated to 2.6% year-over-year from 3.0%, making for a welcome sight.

Source: Briefing.com
 
So, this sounds like good news, but then they claim it’s because of people front running tariffs? Could it be something else?


Sent from my iPhone using Tapatalk
 
Back
Top