As most of you know, every January the Tracker gets reset and we all begin the new year at the same level (zero). That means the allocations for the Top 50 will not be pegged based on the leaders from last year. This can create a skewed allocation shift in the first week of trading in the new year. So while I'm going to post the actual Top 50 as they stand right now, I'll let you know how much last year's leaders shifted their allocations in the past week so you can see the difference.
So here's how we are positioned entering the first week of the new year:
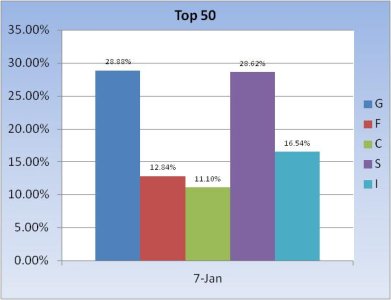
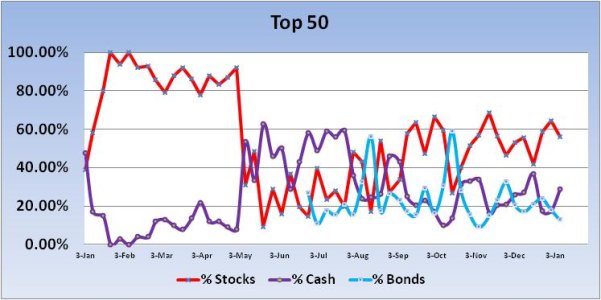
The leaders for the first week of the new year start out with a lower stock allocation than the group that owned these positions just last week. The new group begins with a stock allocation of 56.26%, while the Top 50 from last week actually increased their stock positions from 64.4% to 68%, a relatively modest jump of 3.6%. So the chart above shows a dip in stock allocations, which is consistent with where the current Top 50 are positioned, but if the same TSPers from last week were still in the top positions, stock allocations would have risen a bit.
There's really nothing too meaningful here in my opinion.
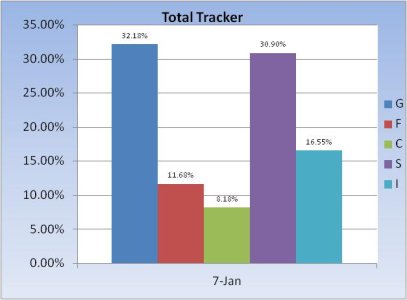
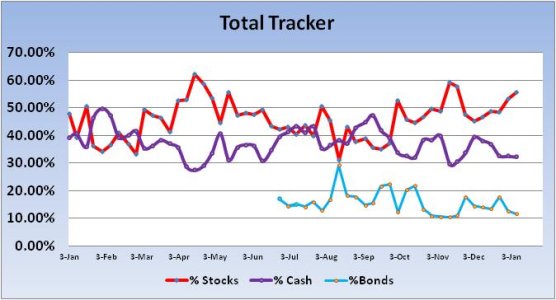
The Total Tracker shows a stock allocation very near that of the current Top 50. Their total allocation is 55.63%, a modest rise of 2.31% from last week.
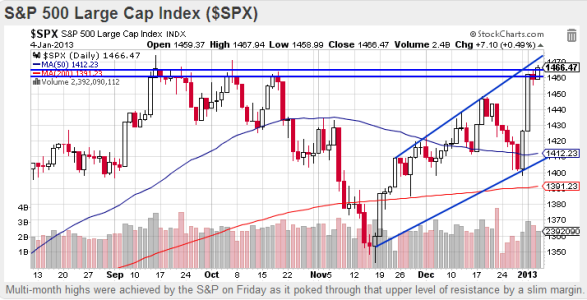
A look at the S&P 500 shows we've covered a lot of ground in a short period of time. There's room to push further to the upside, but price is already close to that upper trend line. I haven't posted it here, but If you take the time to look at the Wilshire 4500 chart, you'd see that price is already well above its upper trend line. These are bullish charts, but we are indeed overbought in the short term. I'm anticipating a pullback to the upper 1440s on the S&P in the days ahead and the low 730s on the Wishire.
Another reason to anticipate a pullback here is that our sentiment survey shows too much bullishness, and that flipped our sentiment survey to a sell condition for this week.
The main thing to keep in mind is that while we're overbought in the short term the intermediate term still remains up.
So here's how we are positioned entering the first week of the new year:


The leaders for the first week of the new year start out with a lower stock allocation than the group that owned these positions just last week. The new group begins with a stock allocation of 56.26%, while the Top 50 from last week actually increased their stock positions from 64.4% to 68%, a relatively modest jump of 3.6%. So the chart above shows a dip in stock allocations, which is consistent with where the current Top 50 are positioned, but if the same TSPers from last week were still in the top positions, stock allocations would have risen a bit.
There's really nothing too meaningful here in my opinion.


The Total Tracker shows a stock allocation very near that of the current Top 50. Their total allocation is 55.63%, a modest rise of 2.31% from last week.

A look at the S&P 500 shows we've covered a lot of ground in a short period of time. There's room to push further to the upside, but price is already close to that upper trend line. I haven't posted it here, but If you take the time to look at the Wilshire 4500 chart, you'd see that price is already well above its upper trend line. These are bullish charts, but we are indeed overbought in the short term. I'm anticipating a pullback to the upper 1440s on the S&P in the days ahead and the low 730s on the Wishire.
Another reason to anticipate a pullback here is that our sentiment survey shows too much bullishness, and that flipped our sentiment survey to a sell condition for this week.
The main thing to keep in mind is that while we're overbought in the short term the intermediate term still remains up.
