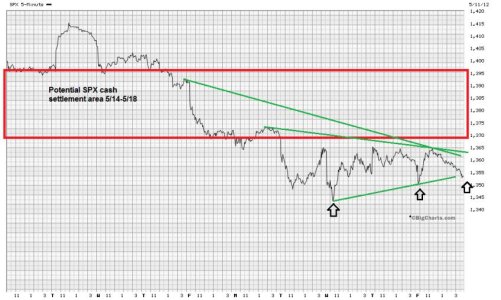
Here is an options expiration potential range for the SP 500 index for this week; May 14-18, 2012. It’s a bit tricky because options are a moving target, and I don’t have formulas that update automatically at this time. Based on options open interest as of the close on May 11, 2012, formula and statistics, the following is a potential range for this week: 1370-1397. This area can be seen within the red box in the chart below. The box may be subjected to some minor shifting, as options are exercised. Keep in mind the ideas and computation is experimental at this time.

Actually I was surprised how closely the range inside the red box lined up with chart support/resistance. You can also see we have a wedge forming under the box (green lines), that would have to break to the upside for this scenario to play out. There was a test on Wednesday and Friday that failed to break the lower line (black arrows) and it was being tested yet again at the very end of the session on Friday. If this wedge breaks down, then this analysis is rejected. The primary trend is clearly down, but the market offered sufficient divergences and other clues on Friday that a relief rally may be the works. The market is at a tricky juncture to sum it all up. Thanks for reading.

Actually I was surprised how closely the range inside the red box lined up with chart support/resistance. You can also see we have a wedge forming under the box (green lines), that would have to break to the upside for this scenario to play out. There was a test on Wednesday and Friday that failed to break the lower line (black arrows) and it was being tested yet again at the very end of the session on Friday. If this wedge breaks down, then this analysis is rejected. The primary trend is clearly down, but the market offered sufficient divergences and other clues on Friday that a relief rally may be the works. The market is at a tricky juncture to sum it all up. Thanks for reading.
