Last week I said I had another Total Tracker buy signal as the auto-tracker was showing a collective stock exposure of less than 40% (and for the 3rd week in a row too). But I also said that I don't use this signal as a stand-alone indicator, because like all indicators it can be wrong at times (on a week over week basis). We were certainly due for a pullback though as the indexes were at or above the upper end of trend lines as well as bollinger bands. And if price is to continue moving higher, we need a pullback on occasion. So now we've got one. Is the low in? It could go either way in the short term, but the trend remains up in the longer term. Here's this week's charts:
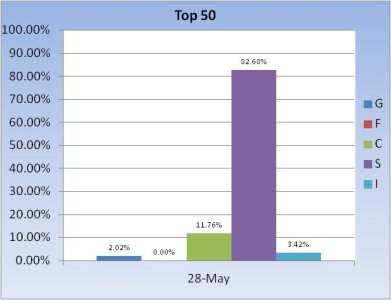
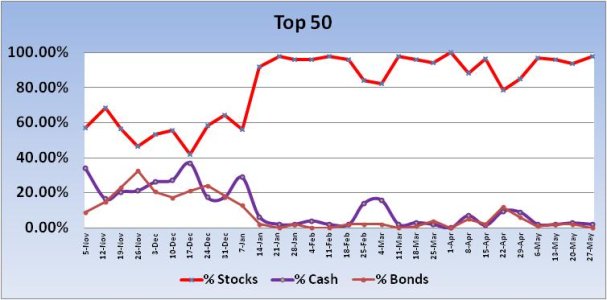
The Top 50 increased their collective stock exposure by 3.98%, from 93.88% last week to 97.86% this week. They've maintained a high exposure to stocks since the 3rd week of January, with the lowest exposure coming on 22 April at 78.6%. Most weeks they've been over 90%.
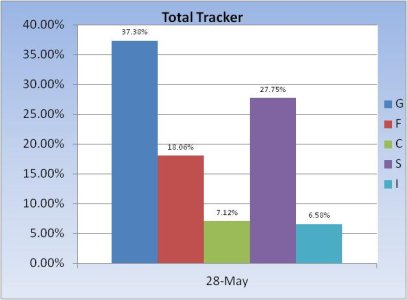
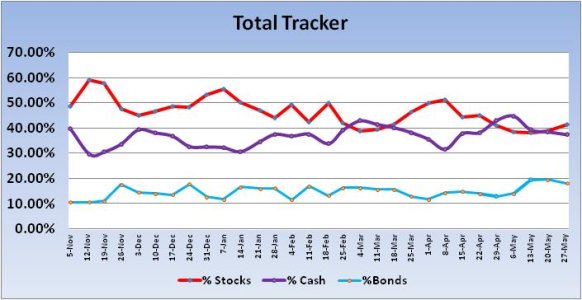
The Total Tracker is showing a relatively modest increase in stock exposure going into the new trading week. It's up 2.73% from 38.72% last week to 41.45% this week. That's not enough of an increase to get me concerned beyond the very short term. Fact is, it's low enough to continue to highly suggest the longer term uptrend remains intact.
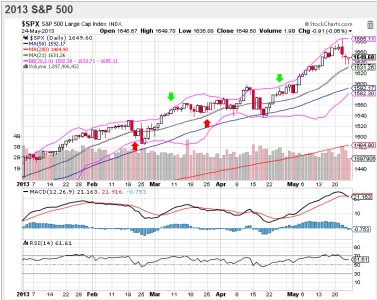
I'm posting my S&P 500 chart with different indicators this week. Rather than use support and resistance trend lines, we'll look at the bollinger bands. Looking at the chart, we can see price is still above the 21 dma, which also happens to be about the mid-way point between the bollinger bands. Previous dips since January have not been particularly deep and only two dips managed to drop below the 21 dma, with the dip in April managing to tag the 50 dma as well. It was enough weakness to shake many weak handed bulls and turn many mechanical systems to sell conditions. Then it was off to the races once again. One constant was the underlying support for this market never dropped by more than about 50%, with both dips coinciding with the drop off in liquidity. The weakness we had last week appears to be a similar setup. Yes, MACD is very high and pointing lower at the moment, but RSI, while dipping late last week, is still showing relative strength. We can certainly get more weakness this week. The current dip has not done that much damage. So it is conceivable we could fall to the 50 dma, which would probably have all kinds of technical bells and whistles going off. Walk it up to the precipice again and I'll bet the bears come out of the woodwork once again. The thing to watch is whether underlying support remains at least moderately firm or falls away to new lows, in which case it could be signaling the game is changing. But that's not my expectation. I'm thinking the market finds its footing soon, although I'll allow for more weakness to get the table set for a reversal.
The arrows are intermediate term signals, but they are only personal reference points and not markers for market entry and exits by themselves. I have other indicators that I use that are not shown on this chart and they provide additional market context.
Our sentiment survey came in at 43% bulls to 48% bears for yet another buy signal. That dovetails nicely with everything I'm looking at going into the new week. So bottom line is that we may be seeing a pick up in volatility and perhaps a bit more downside action, but the longer term continues to point higher.


The Top 50 increased their collective stock exposure by 3.98%, from 93.88% last week to 97.86% this week. They've maintained a high exposure to stocks since the 3rd week of January, with the lowest exposure coming on 22 April at 78.6%. Most weeks they've been over 90%.


The Total Tracker is showing a relatively modest increase in stock exposure going into the new trading week. It's up 2.73% from 38.72% last week to 41.45% this week. That's not enough of an increase to get me concerned beyond the very short term. Fact is, it's low enough to continue to highly suggest the longer term uptrend remains intact.

I'm posting my S&P 500 chart with different indicators this week. Rather than use support and resistance trend lines, we'll look at the bollinger bands. Looking at the chart, we can see price is still above the 21 dma, which also happens to be about the mid-way point between the bollinger bands. Previous dips since January have not been particularly deep and only two dips managed to drop below the 21 dma, with the dip in April managing to tag the 50 dma as well. It was enough weakness to shake many weak handed bulls and turn many mechanical systems to sell conditions. Then it was off to the races once again. One constant was the underlying support for this market never dropped by more than about 50%, with both dips coinciding with the drop off in liquidity. The weakness we had last week appears to be a similar setup. Yes, MACD is very high and pointing lower at the moment, but RSI, while dipping late last week, is still showing relative strength. We can certainly get more weakness this week. The current dip has not done that much damage. So it is conceivable we could fall to the 50 dma, which would probably have all kinds of technical bells and whistles going off. Walk it up to the precipice again and I'll bet the bears come out of the woodwork once again. The thing to watch is whether underlying support remains at least moderately firm or falls away to new lows, in which case it could be signaling the game is changing. But that's not my expectation. I'm thinking the market finds its footing soon, although I'll allow for more weakness to get the table set for a reversal.
The arrows are intermediate term signals, but they are only personal reference points and not markers for market entry and exits by themselves. I have other indicators that I use that are not shown on this chart and they provide additional market context.
Our sentiment survey came in at 43% bulls to 48% bears for yet another buy signal. That dovetails nicely with everything I'm looking at going into the new week. So bottom line is that we may be seeing a pick up in volatility and perhaps a bit more downside action, but the longer term continues to point higher.
