Last week I posted some statistics that showed that when the Top 50 increased their stock holdings by more than 17% for a given week, the market often produced a weekly gain. In fact, the Top 50 had been correct six of the last seven times using this metric.
Make that six of the last eight times, as the S fund was punished with a weekly loss of 6.5% this past week.
I suspect the fact that this is now a bear market helped trip up some of our TSPers.
Here's how we look going into this week:


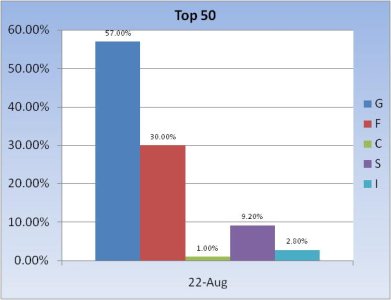
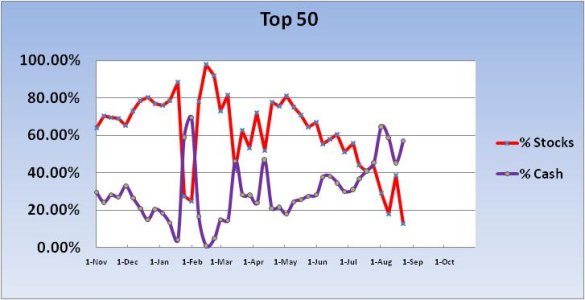
Another dramatic shift for the Top 50 this week, only this time instead of a increasing their stock position, they've shunned stocks. For the coming week, they've reduced stock exposure by 25.7%! Total stock exposure is now a paltry 13%. However, the F fund has found renewed interest with a total exposure there of 30%.


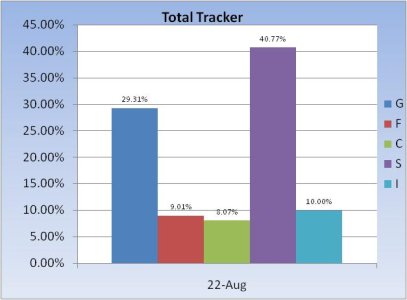
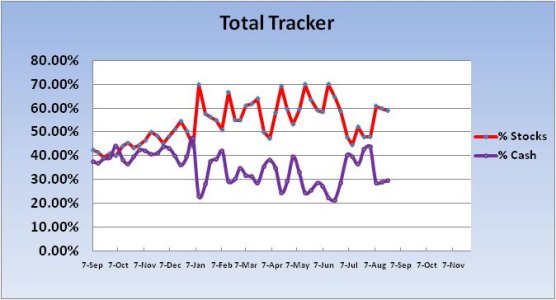
The herd barely twitched after last week's latest blood-letting, reducing total stock exposure by a mere 0.99%. Even F fund holdings are less than one third that of the Top 50. And total stock exposure is a lofty 58.84%.
I could show you more statistics, but now that we are in a bear market I don't think the results I've so far compiled would be useful since they were derived in a bull market.
I'm not sure what to make of this week's readings. Our sentiment survey for this coming week was overwhelmingly bearish (bullish) with a bearish reading of 65%. That's a buy, and I would think a rally might be on tap for next week, but with a total stock exposure of near 59% I'm not overly confident that the weekly tally will be green.
So as always, we'll see how it goes. The Seven Sentinels remain solidly on an intermediate term sell and that means more to me than anything other indicator right now. We'll get another rally eventually, but my charts aren't showing a set-up for one in the short term.
