The Top 50 continues to ride the uptrend, while the Total Tracker shows profit taking. Here's this week's charts:
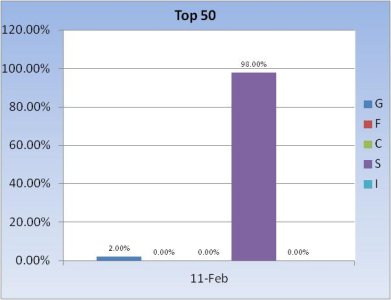
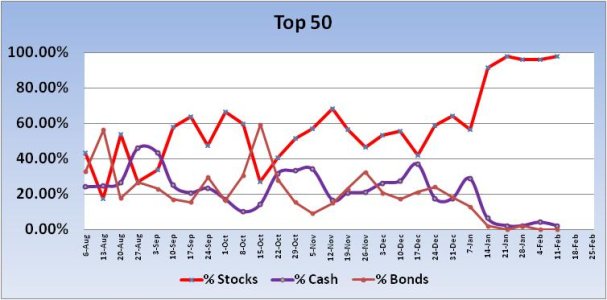
For the 5th week in a row, the Top 50 remains overwhelmingly in the S fund.
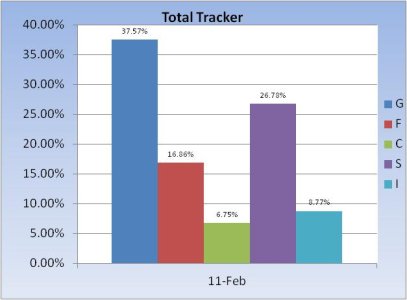
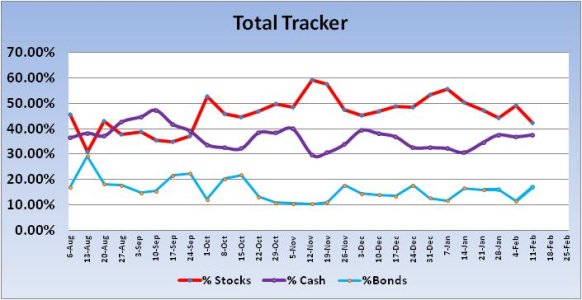
On the other hand, the Total Tracker saw stock allocations dip 6.93%, from a total allocation of 49.23% last week, to 42.3% this week.
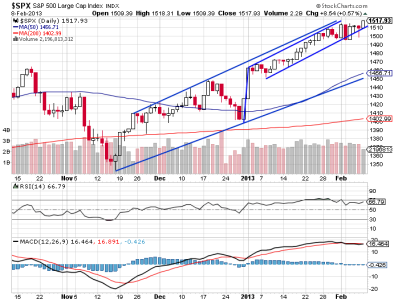
The S&P 500 remains firmly in an intermediate term uptrend. We can see price continues to track in a narrow range within the upper and lower trend lines. MACD has flattened out, while RSI remains relatively strong.
Given the fairly strong dip in stock allocations across the total tracker last week, it's not surprising that our sentiment survey came in on the bearish side with 36% bulls vs 52% bears. That's bullish and put the system back into a buy condition.
It could be awhile yet before this market sees a serious decline with sentiment readings like this. Even so, strength remains the biggest driver of this rally and until that abates we're likely headed higher.


For the 5th week in a row, the Top 50 remains overwhelmingly in the S fund.


On the other hand, the Total Tracker saw stock allocations dip 6.93%, from a total allocation of 49.23% last week, to 42.3% this week.

The S&P 500 remains firmly in an intermediate term uptrend. We can see price continues to track in a narrow range within the upper and lower trend lines. MACD has flattened out, while RSI remains relatively strong.
Given the fairly strong dip in stock allocations across the total tracker last week, it's not surprising that our sentiment survey came in on the bearish side with 36% bulls vs 52% bears. That's bullish and put the system back into a buy condition.
It could be awhile yet before this market sees a serious decline with sentiment readings like this. Even so, strength remains the biggest driver of this rally and until that abates we're likely headed higher.
