This should be the last of this series where we discuss where the S&P 500's low was most often found within any given time-frame.
In the The First 4 Months Blog, we looked at the 4-Month low (of the first 4-months) "When Jan was the 4-month low, the year closed positive 94% of the time."
In the February Blog, we looked at the yearly lows, "56% of the yearly lows fall within the 1st quarter and of the 17 years the index closed down, the yearly low was in the 2nd, 3rd, or 4th quarter (not the 1st)."
In the Where to find the Monthly Low? Blog, we looked for commonalities within the months, there wasn't much of an edge, but there were some slight advantages.
"Across all 759 monthly lows and trading sessions 1-23, Wednesday had a slight edge at 22.3% while Thursday was least likely with 17.9%."
"66% of monthly lows were a combination of: < 10-MA, > 20-MA, < 50-MA, > 200-MA, > 500-MA"
Now I want to focus on the Maximum Draw-Down of the index over any 1-63 session combination. To get the full spectrum of 1-63 day performance, I had to dig back into 1961, so that everything here represented is a full 1-63 sessions during the 1962-2024 time-frame.
If you're in the Index, this will give you an idea of how much pain you might endure if you hold during a downturn.
If you're on the sidelines, this will give you some idea (or a realistic expectation) of how bad it can get before you might jump back in.
I'll start small then work to larger losses. I won't post the positive Max Gain charts, but I'll list the results as a comparison.
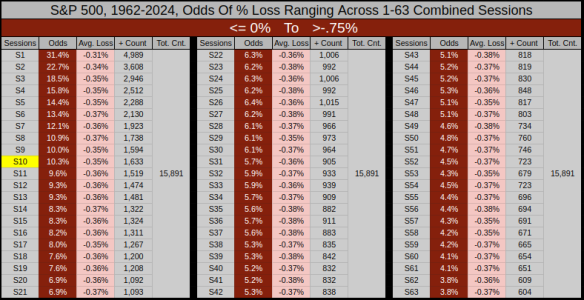
Let's say you just jumped out with a nice gain and you want to wait for a small pullback ranging from 0% to -.75%
If you stay out for 10-Sessions, it's a 10.3% chance of avoiding a -.35% average loss. Vs. (had you stayed in), it's a 12% chance of a .38% average gain.
The losing odds drop from 10.3% at 10-sessions to 3.8% at 63-sessions, so the longer you stay on the sidelines, the more likely you'll lose the edge you're looking for.
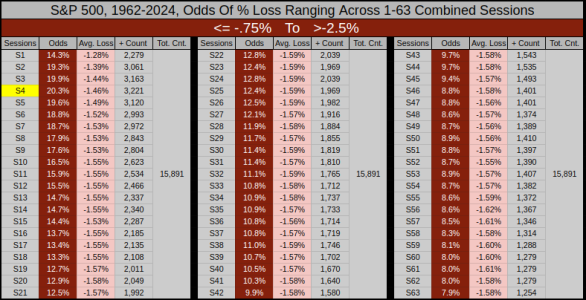
Let's bump it down and increase the range from -.75% to -2.5%
The peak opportunity to avoid a loss was at the 4th-session.
If you had stayed out 4-Sessions, it's a 20.3% chance of avoiding a -1.46% average loss. Vs. (had you stayed in), it's a 28% chance of a 1.45% average gain.
In a bull market, this is "perhaps" or mostly likely the set of data I'd find useful. Basically, if you stay out more than 4-sessions, the odds of you gaining an edge gradually reduce to 7.9% out to the 63rd session.
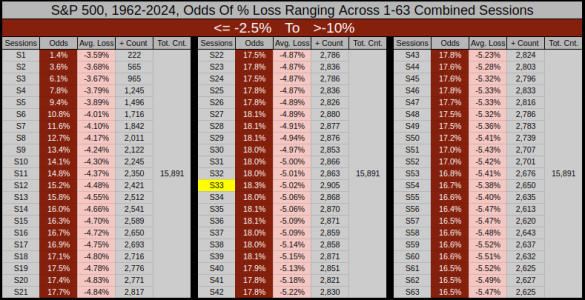
As a guide, I view anything short of -10% as a pullback.
Here's the -2.5% to -10% range. These types of pullbacks don't happen often, if we're lucky, we might get 2-3 a year. But during a bull market, these are the most critical events, and really the only way to gain an edge over what is already an index with a strong 73% win ratio over the past 63-years. Also, the deeper down we go, the more likely we are incorporating bear market conditions.
The peak opportunity to avoid a loss was at the 33rd-session.
If you had stayed out for 33-Sessions, it's a 18.3% chance of avoiding a -5.02% average loss. Vs. (had you stayed in), it's a 37.1% chance of a 5.10% average gain.
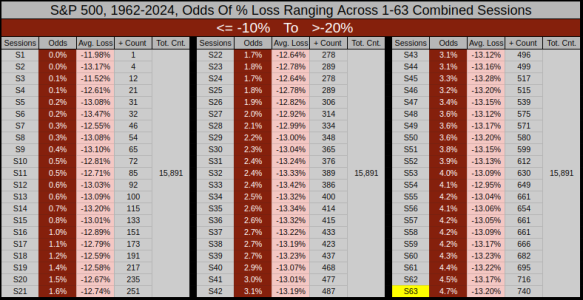
Now we'll look at "Correction" territory which ranges from -10% to 20%.
We can see these events are somewhat rare, and now we are digging into "world crisis" type events, where the 63rd session has the the worst odds.
If you had stayed out for 63-Sessions, it's a 4.7% chance of avoiding a -13.20% average loss. Vs. (had you stayed in), it's a 9.9% chance of a 12.95% average gain.
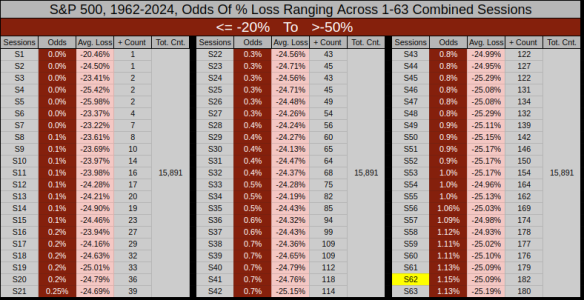
Lastly we have full-on Bear Market conditions ranging from -20% to -50%.
So the worst performance was at the 62nd-sesssion.
If you had stayed out for 62-Sessions, it's a 1.15% chance of avoiding a -25.09% average loss. Vs. (had you stayed in), it's a .77% chance of a 25.22% average gain.
It's important to consider, I don't have the Maximum Draw-down going further than 63-sessions.
As an example, from Oct-07 to Mar-2009 the Maximum Closing Draw-down was 356-Sessions with a loss of -56.78%
Another unexplored topic, I have not added additional filters which may increase the statistical odds, such as above or below the 200MA. This data just represents what has happened (not what will happen).
Thanks for reading... Jason
In the The First 4 Months Blog, we looked at the 4-Month low (of the first 4-months) "When Jan was the 4-month low, the year closed positive 94% of the time."
In the February Blog, we looked at the yearly lows, "56% of the yearly lows fall within the 1st quarter and of the 17 years the index closed down, the yearly low was in the 2nd, 3rd, or 4th quarter (not the 1st)."
In the Where to find the Monthly Low? Blog, we looked for commonalities within the months, there wasn't much of an edge, but there were some slight advantages.
"Across all 759 monthly lows and trading sessions 1-23, Wednesday had a slight edge at 22.3% while Thursday was least likely with 17.9%."
"66% of monthly lows were a combination of: < 10-MA, > 20-MA, < 50-MA, > 200-MA, > 500-MA"
Now I want to focus on the Maximum Draw-Down of the index over any 1-63 session combination. To get the full spectrum of 1-63 day performance, I had to dig back into 1961, so that everything here represented is a full 1-63 sessions during the 1962-2024 time-frame.
If you're in the Index, this will give you an idea of how much pain you might endure if you hold during a downturn.
If you're on the sidelines, this will give you some idea (or a realistic expectation) of how bad it can get before you might jump back in.
I'll start small then work to larger losses. I won't post the positive Max Gain charts, but I'll list the results as a comparison.
Let's say you just jumped out with a nice gain and you want to wait for a small pullback ranging from 0% to -.75%
If you stay out for 10-Sessions, it's a 10.3% chance of avoiding a -.35% average loss. Vs. (had you stayed in), it's a 12% chance of a .38% average gain.
The losing odds drop from 10.3% at 10-sessions to 3.8% at 63-sessions, so the longer you stay on the sidelines, the more likely you'll lose the edge you're looking for.

Let's bump it down and increase the range from -.75% to -2.5%
The peak opportunity to avoid a loss was at the 4th-session.
If you had stayed out 4-Sessions, it's a 20.3% chance of avoiding a -1.46% average loss. Vs. (had you stayed in), it's a 28% chance of a 1.45% average gain.
In a bull market, this is "perhaps" or mostly likely the set of data I'd find useful. Basically, if you stay out more than 4-sessions, the odds of you gaining an edge gradually reduce to 7.9% out to the 63rd session.

As a guide, I view anything short of -10% as a pullback.
Here's the -2.5% to -10% range. These types of pullbacks don't happen often, if we're lucky, we might get 2-3 a year. But during a bull market, these are the most critical events, and really the only way to gain an edge over what is already an index with a strong 73% win ratio over the past 63-years. Also, the deeper down we go, the more likely we are incorporating bear market conditions.
The peak opportunity to avoid a loss was at the 33rd-session.
If you had stayed out for 33-Sessions, it's a 18.3% chance of avoiding a -5.02% average loss. Vs. (had you stayed in), it's a 37.1% chance of a 5.10% average gain.

Now we'll look at "Correction" territory which ranges from -10% to 20%.
We can see these events are somewhat rare, and now we are digging into "world crisis" type events, where the 63rd session has the the worst odds.
If you had stayed out for 63-Sessions, it's a 4.7% chance of avoiding a -13.20% average loss. Vs. (had you stayed in), it's a 9.9% chance of a 12.95% average gain.

Lastly we have full-on Bear Market conditions ranging from -20% to -50%.
So the worst performance was at the 62nd-sesssion.
If you had stayed out for 62-Sessions, it's a 1.15% chance of avoiding a -25.09% average loss. Vs. (had you stayed in), it's a .77% chance of a 25.22% average gain.
It's important to consider, I don't have the Maximum Draw-down going further than 63-sessions.
As an example, from Oct-07 to Mar-2009 the Maximum Closing Draw-down was 356-Sessions with a loss of -56.78%
Another unexplored topic, I have not added additional filters which may increase the statistical odds, such as above or below the 200MA. This data just represents what has happened (not what will happen).

Thanks for reading... Jason
