lkatteng Account Talk

  • Thread starter Thread starter TheProphet
  • Start date Start date
T

TheProphet

Guest
imported post

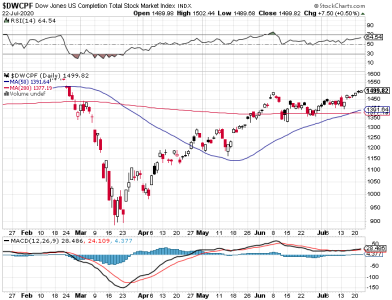
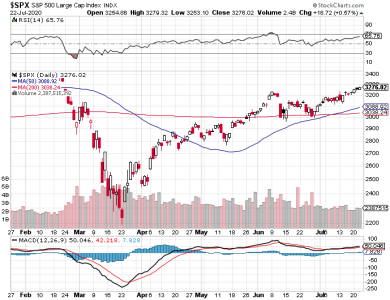
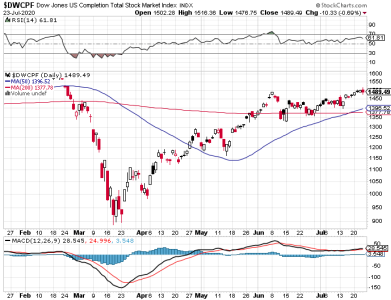
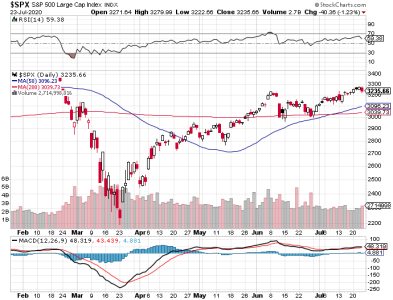
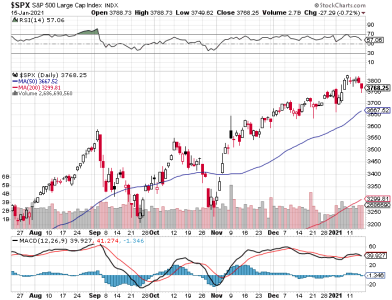
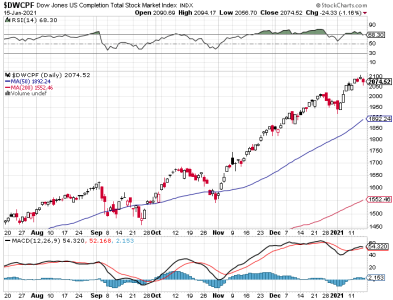
I do follow the MACD indicator... MACD stands for Moving Average Convergence Divergence... I learned from
the Stocktrader Almanac... it seems to work real good...
at least for me... however I always search for fundamental
confirmations... News... CNBC, Louis Rukeyser, Business News from London... Friends analysis, etc... So far i am very happy with the return of my TSP account... which I track its rate of return on a daily basis today 54% YTD...
But I think I can do even better... Even thou I will be happy if I get 20% a year and the BRAC does not close us...
till I retire... I still have few more years to go...
I just turn 50 years old this year...
 
imported post

lkatteng wrote:
So far i am very happy with the return of my TSP account... which I track its rate of return on a daily basis today 54% YTD...
54%? Uh boy.

lkatteng, do you want to start your own account here so we can follow your transactions and returns? Let me know and I'll set it up for you. You can read more about that here... [url]http://www.tsptalk.com/mb/forum21/91.html[/url]

Thanks,
Tom
 
imported post

Tom,

Ineed to clearify... 54% included my contribution and catch ups because I am after fifty...

How do I click on forum tab ?

Please go ahead and set me with a tracing account to track my performance...

I thing your idea of monthly competition will be fun...

let's do it...

Leon
 
imported post

lkatteng,

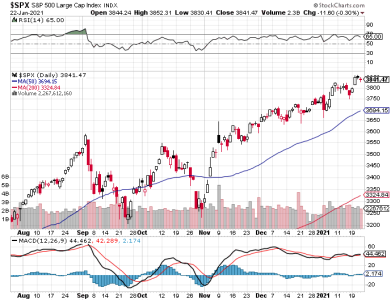
Please explain this "MACD indicator" Where do youfind it? How do you read it?
What do you look for todetermine moves?
Which funds do you move into or out of and why?

If you can, give us some past dates this will help me understand just how well you are actually doing. Dates when you made moves including where you moved from/to with fund percentages. (3, 6 or 9 months worth).

CJ
 
imported post

MACD stands for Moving Average Convergence Divergence. This technique is one of the most often used by the different simulator software as performing the technical analysis of stock trend using this method is easy and very straightforward. As I mentioned, the MACD works well both for a "long term", middle term and intraday trading systems. The Stock Traders Almanac uses to determine their
recommendation to buy and sale around every six month...
You also may find it in any technical charts... at yahoo.com or pcquote.com

You may find info at the web... on of many is below...
http://trader.snowseed.com/macd.htm
signals are generated when the line crosses zero. Crossing from negative into the positive is considered a buy signal, while crossing from the positive to negative is considered a sell signal. When the stock price is rising and MACD is falling (negative divergence), or vice versa, it can be considered an indication of "something going on" and can be used to predict changes in a trend.

I personal use many parameters into my personal trading algoritm...
The main categories are: Trent, Cycles, Seasonal, ramdon or irregular events to detemine my movements...
Samples of trents may be pre-election year, historical best six months of the year... etc..
Samples of cycles, events indepently from time)even thou we use time as a refernce including moon cycles,FOMC meetings, triple wishes, expiration dates, etc...
Sample of seasonal are around holidays and weather...
Christmas rally, Thanksgiving, Labor Day, Independence Day, Eater, New Year rally etc...
Sample of the random events are all kind of news...

Their is a 25 year compressed into one single year chart of the ratio between Russell 2000 and Russell 1000 I look close to that chart to determine into which fund C or S to get into... their are times the C funds perform better than the S funds... even thou the S fund in general is better performer when interest rate is low... as it is now... and even better the I fund due to the low dollar price index...

I keep a daily excel spread sheet and in which fund am I into and my total balance and % performed Year To Date.

I do have a simple and free personal webpage where I post my position... for anyone willing to know my position(s)...

http://www.geocities.com/earn100kplus/TSP.html?1096437973070

I usually 100% on the best I determine is the best at that time... right now I am 100% on G...

I do not read the future but I do educated decisions... ;-)

I do not have a crystal ball neither... and I make few mistakes and not always get into or out when I should.
I strongly belief that the market (DOW, S&P, Russell 2000) translated to C and S funds for me) will give me the chance to come out always with profit if I get into on a lowest possible point, at the right time, and I am patient enough... History prove my belief...

Thank you for invite me to I shared some few lines with...

Please feel free to keep in touch...

Leon

Leon.Kattengell@us.army.mil
 

Attachments

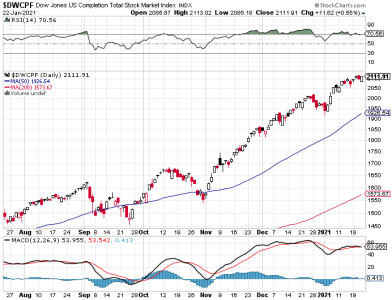
  • DWCPF.png
    DWCPF.png
    37 KB · Views: 276
  • S&P 500.png
    S&P 500.png
    39.5 KB · Views: 283
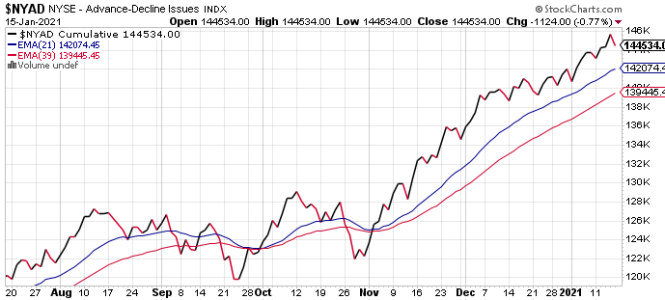
  • NYAD.png
    NYAD.png
    35.4 KB · Views: 271
imported post

lkatteng wrote:
Tom,

Ineed to clearify... 54% included my contribution and catch ups because I am after fifty...
Oh, I see,

Please go ahead and set me with a tracing account to track my performance...
Great, consider it done. :^ This will be it!
 

Attachments

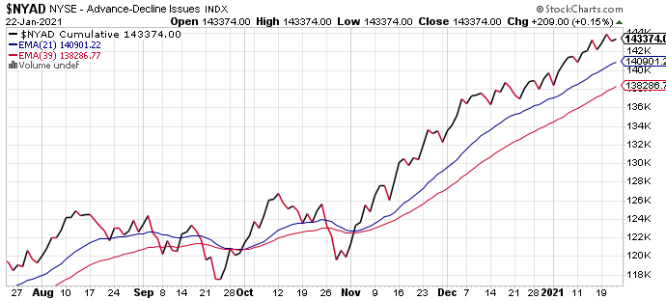
  • NYAD.png
    NYAD.png
    35.8 KB · Views: 215
  • DWCPF.png
    DWCPF.png
    36.8 KB · Views: 251
  • S&P 500.png
    S&P 500.png
    39.3 KB · Views: 324
imported post

Hi Ikatteng!

Your system is recognized. Yahoo technical charts have the MACD for use on their charts. Also what you have said is to be aware of the "big picture", using other comparisons. Totally agree!

Currently (since Feb 04) we have a bearish market sloping downward, but with cycles where profits or losses can be made. We have had assaults from weather, oil, earnings, and rates. Timing these cycles, and trying to discover a trend, or if the market will stop the roller coasters is what the problem is, currently. In 2003 you could of bought and held stock and made a profit. 2004 is not that year. It's good that you have a system, please continue your posts to help others understand the variables of investing.

I was once told, that I shouldn't invest any funds that I could not stand losses. Well this is overly pessimistic, I don't intend to be making blind investments, and isn't this what this web site is not about!
 
imported post

Tom,

How does it works ?

Where do I post the info ?

Please help me. Thanks.

Leon
 
imported post

Ikatteng wrote in his account, "If Monday 11 is high, I think Friday 15 will be low.."

I don't think the market will be open for trading on Monday (Columbus Day), will it?
 

Attachments

  • SPX.png
    SPX.png
    42.7 KB · Views: 439
  • DWCPF.png
    DWCPF.png
    38.2 KB · Views: 386
  • NYAD.png
    NYAD.png
    30.9 KB · Views: 194
imported post

I believe it will be closed so maybe that screws up his strategy! I just looked on Yahoo, stockmarket is open but the bond market will be closed because banks will be closed. Bonds will close 1:00 Eastern time on Friday I believe.
 
imported post

Hi everyone! Have been hiding in the shadows watching everyone.:D Markets are open Monday. Banks and government offices will be closed Monday.
 
imported post

Welcome show-me, and thanks!
 

Attachments

  • SPX.png
    SPX.png
    42.5 KB · Views: 411
  • DWCPF.png
    DWCPF.png
    38.4 KB · Views: 324
  • NYAD.png
    NYAD.png
    31 KB · Views: 363
Back
Top