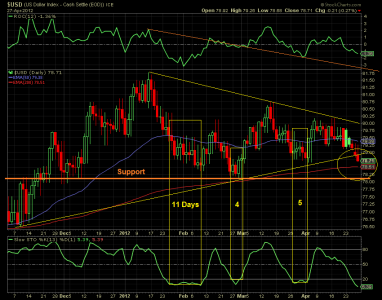
The US Dollar Index (USD) continues its slide and today (04/30/12) broke through a contracting formation (pennant), as viewed on the first chart. The 50 exponential moving average (ema) was breached four trading days ago at 79.38 and now we see a steep decline towards the 200 ema at 78.51. Today (04/30/12) the USD index closed only 0.20 above. Fairly substantial support is near the USD index 78 area. The slow stochastic is quite oversold and may be starting a bottoming process soon. Previous bottoming cycle’s length was 5, 4 and 11 trading days respectively as shown in the rectangle boxes. So, the probability may lie somewhere in-between. After the bottom, a greater degree of market headwinds may surface.

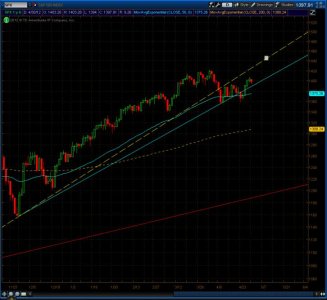
Looking at the next SP 500 chart we see that the dashed trendline forming an angle intersecting the 10/04/11 momentum low and the 11/28/12 momentum low is currently above the market. It will need to climb to backtest this broken trendline. If the backtest fails, then the market will correct. If the backtest gains strength and busts through, then a test of the pre-recession 1550 highs may be on tap. Or, as time expands, the market could slide along the underside and never get over it. An initial price projection for a backtest is 1447, based on Elliot wave theory and fibonacci math. Testing and retesting major support/resistance lines in the market is an ongoing and normal phenomenon. Depending on how the market meanders from here, that level is certainly attainable in less than ten trading days as shown by a target box. Coincidental or not, this timeframe lines up with a possible US dollar reversal.


Looking at the next SP 500 chart we see that the dashed trendline forming an angle intersecting the 10/04/11 momentum low and the 11/28/12 momentum low is currently above the market. It will need to climb to backtest this broken trendline. If the backtest fails, then the market will correct. If the backtest gains strength and busts through, then a test of the pre-recession 1550 highs may be on tap. Or, as time expands, the market could slide along the underside and never get over it. An initial price projection for a backtest is 1447, based on Elliot wave theory and fibonacci math. Testing and retesting major support/resistance lines in the market is an ongoing and normal phenomenon. Depending on how the market meanders from here, that level is certainly attainable in less than ten trading days as shown by a target box. Coincidental or not, this timeframe lines up with a possible US dollar reversal.

