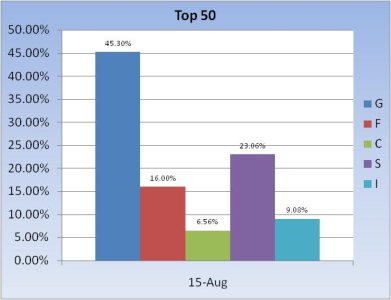
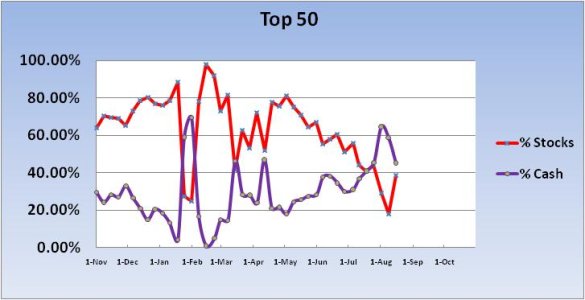
With the severe volatility we've seen over the past couple of weeks, I'm not sure how accurate it may be to isolate a group like the Top 50 with the intent to discern where the market might go over the short term (one week). But in any event, we can see the Top 50 increased their collective stock allocation by a healthy 20.48% going into this week. Still, the total stock allocation is only 38.7%, so there's still quite a bit of conservatism here. And F fund holdings are also healthy at a flat 16%. More on the Top 50 in a moment.
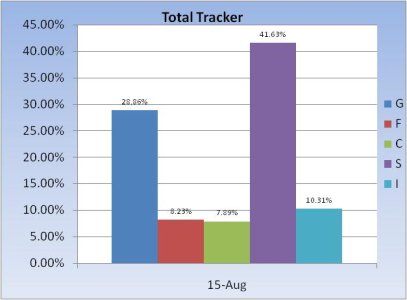
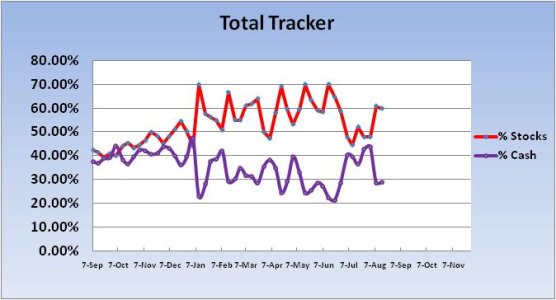
The herd pretty much held their position from last week. The overall stock allocation only dipped by just under 1%. But this group has a much healthier stock allocation of 59.83%.
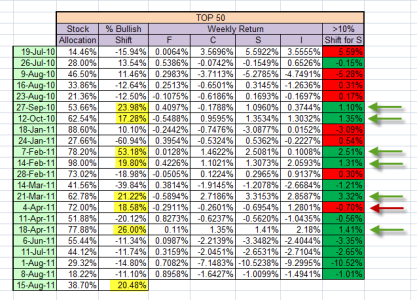
I've posted this spreadsheet before. It's a historical snapshot of how the Top 50 fared during select weeks going back to July 2010. What I'm showing here is those weeks, going back to the week of July 19th 2010, that showed where the Top 50 had a greater than 10% shift in allocation. I use the term "bullish shift" in one the columns to describe that change in stock allocations whether the change was positive or negative. In particular I singled out those times where the shift was positive (increased stock allocation) by more than 17% for a given week. I've marked those weeks with an arrow on the right side of the display.
Remember that this coming week I said the Top 50 increased their stock allocation by 20.48%. Going back to the week of July 19, 2010 the Top 50 has previously increased that allocation by at least 17% seven times previously. Out of those seven times the market was up for the week on six occasions as marked by a green arrow. The one time the Top 50 was wrong (on a weekly basis) was the week of April 4, 2011, and that was only by a relatively modest 0.7%.
I would not hang my hat on this data by itself, but I've been saying that the Seven Sentinels looks bullish for the short term. It's possible that the Top 50 gets it right again all things considered. But in the end, it's all speculative information to some extent, so once again don't read too much into it. I use information like this more as a validation tool for other indicators.
So we'll see how it all plays out and look back at this data next week to see how predictive this information was.
