No major changes to the allocations from last week, but then cash levels were high then and remain high now.
Here's the charts:


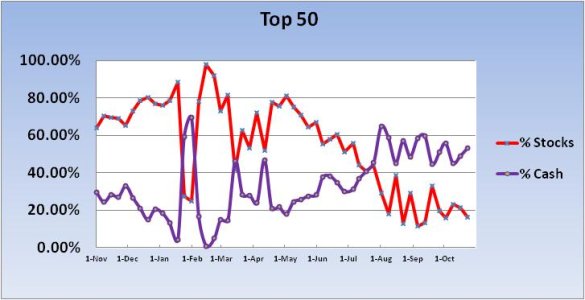
The Top 50 reined in their stock exposure for the second week in a row. Last week their stock allocation was sitting at 21.54%, which is pretty conservative.
Now it's lower.
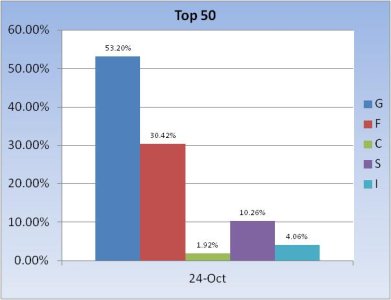
For the up coming week, the Top 50 lowered their overall stock allocation by 5.3% and now have total stock allocation of a paltry 16.24%.
It should also be noted that F fund holdings are at very high levels with a total exposure in the F fund of 30.42%. That's actually a bit interesting given the F fund has gone nowhere since mid-August. But the G fund payed out 0.16% for the month of September (rate of 1.92% annually), which suggests folks are looking to take a shot at higher gains without the over-sized risk associated with the C, S, and I funds.


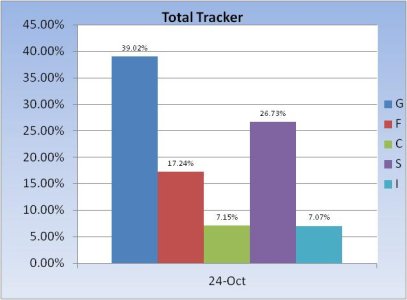
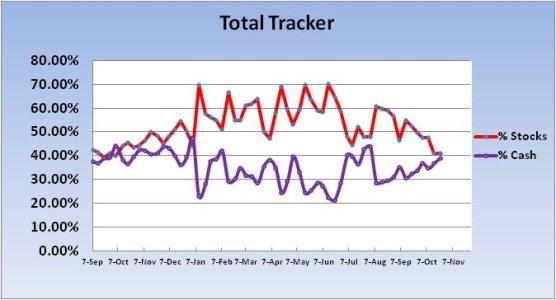
The herd increased their overall stock exposure by 0.11%. Practically flat. Overall stock exposure sits at 40.94%.
My take is that we are avoiding the volatility and perhaps anticipating this bear market to rear its head again at some point. And this is in spite of seasonality being in our favor. However, seasonality isn't exactly comforting given the S&P 500 is 163 points above its intraday low set less than 3 weeks ago. It's now higher by a bit more than 15% in that time. It's certainly fair to be highly cautious after such a run-up.
I'll be checking sentiment later this evening in other pockets of the market to update my view from last week that sentiment is overall supportive of market prices. Our own sentiment survey remains on a hold (G fund) with 40% bulls and 49% bears. But even with supportive sentiment the market normally has to draw down from time to time in order to consolidate in an effort to possibly launch another up-leg down the road. For that reason, I'm anticipating lower prices this week before another run higher. We'll see if that's the case soon enough.
Here's the charts:


The Top 50 reined in their stock exposure for the second week in a row. Last week their stock allocation was sitting at 21.54%, which is pretty conservative.
Now it's lower.
For the up coming week, the Top 50 lowered their overall stock allocation by 5.3% and now have total stock allocation of a paltry 16.24%.
It should also be noted that F fund holdings are at very high levels with a total exposure in the F fund of 30.42%. That's actually a bit interesting given the F fund has gone nowhere since mid-August. But the G fund payed out 0.16% for the month of September (rate of 1.92% annually), which suggests folks are looking to take a shot at higher gains without the over-sized risk associated with the C, S, and I funds.


The herd increased their overall stock exposure by 0.11%. Practically flat. Overall stock exposure sits at 40.94%.
My take is that we are avoiding the volatility and perhaps anticipating this bear market to rear its head again at some point. And this is in spite of seasonality being in our favor. However, seasonality isn't exactly comforting given the S&P 500 is 163 points above its intraday low set less than 3 weeks ago. It's now higher by a bit more than 15% in that time. It's certainly fair to be highly cautious after such a run-up.
I'll be checking sentiment later this evening in other pockets of the market to update my view from last week that sentiment is overall supportive of market prices. Our own sentiment survey remains on a hold (G fund) with 40% bulls and 49% bears. But even with supportive sentiment the market normally has to draw down from time to time in order to consolidate in an effort to possibly launch another up-leg down the road. For that reason, I'm anticipating lower prices this week before another run higher. We'll see if that's the case soon enough.
