The Seven Sentinels remain in a buy condition, but now that the last trading day of 2010 is over I wanted to take a look at where they stand going into the new year.
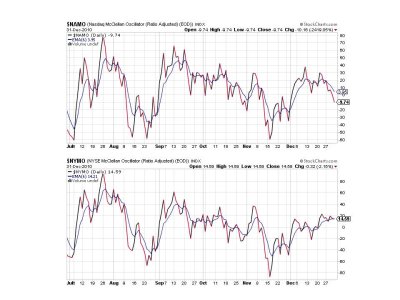
NAMO has definitely taken a turn lower the past few trading days, while NYMO has tracked mostly sideways. NAMO is on a sell while NYMO is just barely a buy.
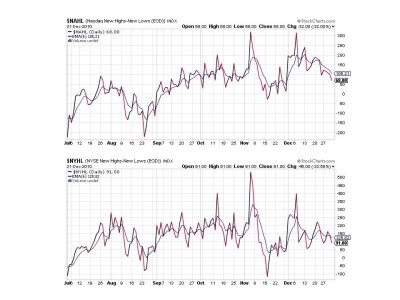
Not surprisingly, NAHL is tracking lower while NYHL is moving sideways. Both are flashing sells.
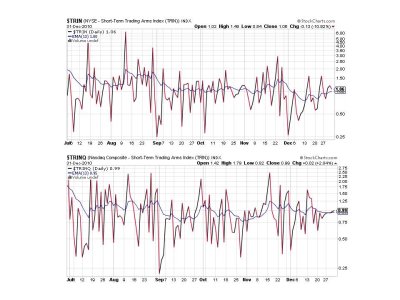
Both TRIN and TRINQ are also flashing sells, but only barely. They are basically giving a neutral reading right now.
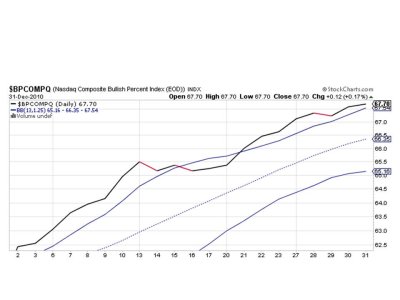
BPCOMPQ remains on a buy and is tracking just North of the upper the bollinger band.
Overall, I'd say the charts look tired and with the overall high bullish sentiment we've been seeing this month I'd say we're due for a correction. But nothing is quite that simple while the Fed continues to deploy QE2. Volatility has largely disappeared, but is it primarily a function of light holiday trading?
Since BPCOMPQ is the one indicator that takes the longest to react to a change in market direction I thought it might be useful to look at a longer term chart of that indicator.
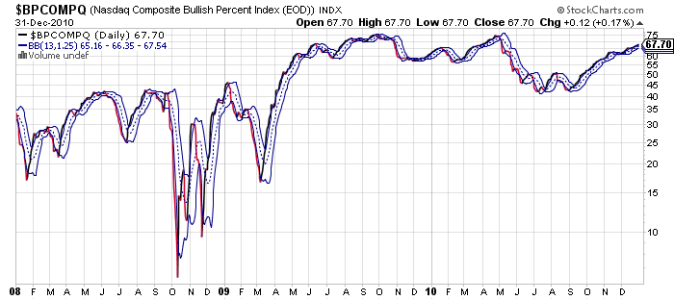
A reading over 70% is considered overbought by this measure. As you can see we aren't quite there yet, but we're getting close. But looking at the past 2 years we can see that this indicator has spent a lot of time bouncing around in this area. It's peaked around 75% twice. Once between August and October of 2009 (notice is stayed elevated here during those three months) while the last 75% reading was April of this year. In that case it went into a sustained decline after hitting that peak.
Of course, it doesn't have to hit above 70% before a correction can happen, but given its current reading I think we can anticipate a turn within the next few weeks.

NAMO has definitely taken a turn lower the past few trading days, while NYMO has tracked mostly sideways. NAMO is on a sell while NYMO is just barely a buy.

Not surprisingly, NAHL is tracking lower while NYHL is moving sideways. Both are flashing sells.

Both TRIN and TRINQ are also flashing sells, but only barely. They are basically giving a neutral reading right now.

BPCOMPQ remains on a buy and is tracking just North of the upper the bollinger band.
Overall, I'd say the charts look tired and with the overall high bullish sentiment we've been seeing this month I'd say we're due for a correction. But nothing is quite that simple while the Fed continues to deploy QE2. Volatility has largely disappeared, but is it primarily a function of light holiday trading?
Since BPCOMPQ is the one indicator that takes the longest to react to a change in market direction I thought it might be useful to look at a longer term chart of that indicator.

A reading over 70% is considered overbought by this measure. As you can see we aren't quite there yet, but we're getting close. But looking at the past 2 years we can see that this indicator has spent a lot of time bouncing around in this area. It's peaked around 75% twice. Once between August and October of 2009 (notice is stayed elevated here during those three months) while the last 75% reading was April of this year. In that case it went into a sustained decline after hitting that peak.
Of course, it doesn't have to hit above 70% before a correction can happen, but given its current reading I think we can anticipate a turn within the next few weeks.
