ESP Timer's Account Talk

Sy Harding's Seasonal System

Sy Harding's Seasonal System

The International Fund was the only fund that beat Buy & Hold using Harding's system and it only did that because the 2008 crash occurred during the cash period.

stats.PNG

Here is a chart showing the trades, new features and a vanilla color scheme that seems easier to read (to me).

harding.jpg

Turtle Trading from the 80's couldn't beat Buy & Hold and Sy Harding's Seasonal System from the 90's failed as well. Avoiding once-a-decade crashes appears to be key to beating Buy & Hold.
 
Re: Turtle Trading Rules

Added Percent from SMA graph which shows how far the price is above/below an SMA (in percent). Might be useful for timing or overbought/oversold indicator.

percent 50.jpg

percent 100.jpg

percent 200.jpg
 
Last edited:
Table/Chart

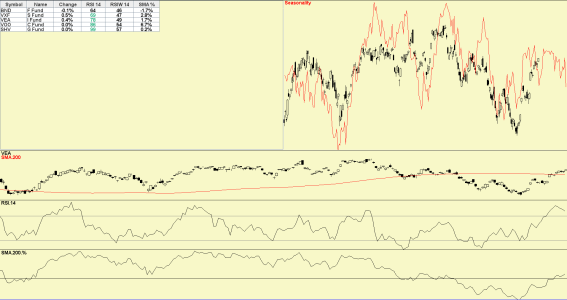
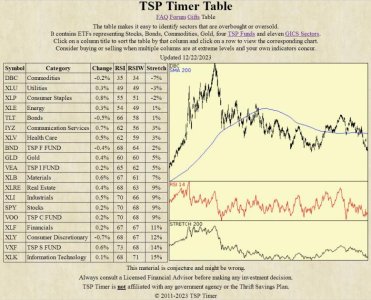
I switched to a table/chart format with the goal of analyzing dozens of symbols in a few minutes instead of the hours that it currently takes me. My program downloads 30 years of stock data, sorts everything by Weekly RSI, loads it into a table that can be sorted on any column and displays the seasonal trend along with as much history as I can fit on the screen. Change is the last trading day’s change. RSI is daily RSI and RSIW is weekly RSI. SMA % is the percent from the 200 SMA (rubber band). Red cells indicate oversold and green cells indicate overbought so symbols with multiple red cells are buy candidates (and vice versa).

tsp.png

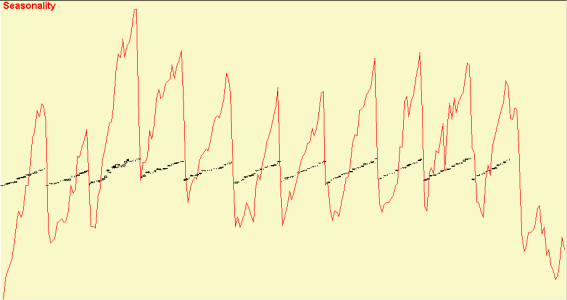
I found ETF's that use the same indices as the TSP funds: G Fund = SHV, F Fund = BND, C Fund = VOO, S Fund = VXF and I Fund = VEA. G/SHV is a problem as bond etf's distribute their income creating a saw tooth pattern. I don't have access to mutual fund data so I guess I will have to live with it until I can find a short-term government stock/ETF that retains income.

shv.PNG

I will eventually merge my old cycle program into the new program to help predict future cycle lows.

cycles.png

Are there any other features that I should consider to make it better/different than Stockcharts.com?

P.S. Open large images in a new tab to see the entire thing.
 
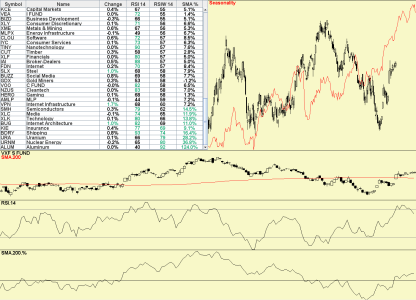
The table format became more useful after I added 80 GICS Industry ETF's to the F, C, S and I Fund ETF's. Now it is easy to look at 84 ETF's and see which ones are oversold (multiple red cells) and which ones are overbought (multiple green cells). The Seasonality chart and Price/Indicator charts show the numbers graphically which helps with eyeball analysis.

s fund.png
 
Last edited:
Web Site

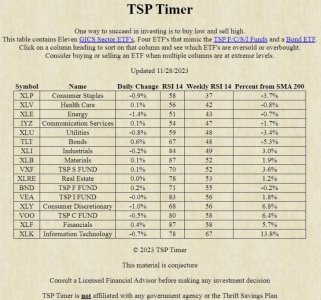
I upgraded my program to generate a sortable HTML table using market data and put the data online at TSP Timer. Next, I plan on color coding the data to indicate extreme overbought/oversold levels. I eventually want to move the program online so it can do automatic updates. Any suggestions on how to make the web site better?

TSPTimer.jpg
 
Last edited:
*** IT'S ALIVE ***

I moved TSP Timer Table to the cloud, added more ETFs, improved the chart and automatically update market data. I have more work to do but I am going to publish it "as-is" and see what people think. Post a description and a screenshot if you run into a problem.

tsptimer.jpg
 
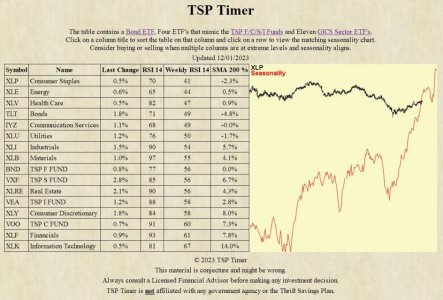
Security and Seasonality

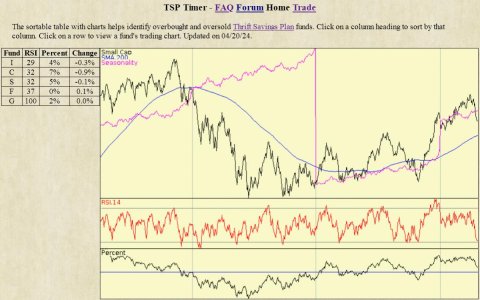
I improved security and added seasonality to TSP Timer Home. I also switched to the core TSP funds for more price history and accurate prices for investment strategy comparison.

tsptimer.jpg
 
Back
Top