ESP Timer's Account Talk

esptimer

New member
Buy & Hold

Here is a chart of TSP funds that have existed since 7/29/2005. There have been a lot of ups and downs along the way plus the temptation to try and avoid large drops. Open the image in a new tab to see the entire chart.

chart.jpg

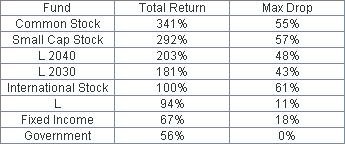
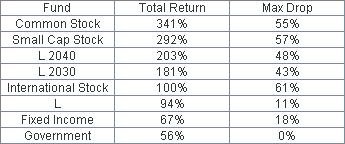
Here are Buy and Hold statistics for the funds sorted by total return and including the largest drops. The Common Stock fund had the highest total return with similar draw-downs to the other stock funds. It is my baseline.

stats.jpg

My goal is to build a mechanical trading system with better returns and less severe draw-downs. Feel free to check my work and suggest improvements as that is the point of posting this stuff here.
 
Last edited:
Thanks for posting. Is ESP for Extra-Sensory Perception? Just wondering. :cheesy: It could certainly help us if it's reliable.
 
TSP Timer wasn't allowed as a username. ESP rhymes with TSP plus I will need all of my psychic energy to compensate for the Thrift Savings Plan trading restrictions.

magic eight ball.jpg
 
Re: ESP Timer's Account Talk

Buy & Hold Blend

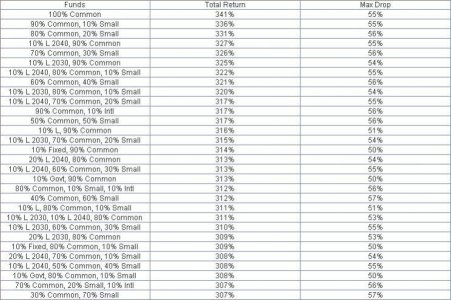
I tried Buying & Holding a blend of funds (like a static Lifecycle fund) to see how it affects returns and drawdowns. Fund percentages ranged from 0% to 100% in 10% increments.

blend.jpg

It doesn't seem to make much difference risk-wise and the Common Stock Fund continued to rule them all over the long term.

stats.jpg
 
Re: ESP Timer's Account Talk

Nobody just dumps their money into TSP and lets it ride. We're constantly adding to it, and that affects returns a great deal.

A more realistic portfolio would be one that includes stocks/bonds such as 70/30, 60/40 or 50/50. The returns are not much different, the risk of max draw down is lower, and often the rise out of the bear market low is quicker.
 
TSP Timer wasn't allowed as a username.

Yes, sorry. We have TSP Timing (Revshark) and Intrepid Timer, so a username of TSP Timer may suggested that this account was part of our premium services. Several years ago I stopped allowing "tsp" as part of a username.

But welcome ESP Timer. Maybe you're onto something! :)
 
Re: ESP Timer's Account Talk

I was a buy and holder until covid. Ater spending time and doing research, I have a better understanding of the charts and realize NOBODY knows for sure what the market will do.
 
My second strategy included all combinations of TSP funds in 10% increments. No low draw-down strategy made it into the top 30 gainers.

Including periodic contributions needlessly complicates the calculation and comparison of potential strategies. If I come up with a workable system then I will include contributions in the model. Does a 100k starting value and 1k per month contribution sound like a reasonable scenario?
 
EMA/SMA Crosses

EMA/SMA Crosses

I added EMA/SMA crosses, color coded charts (green = buy, black = sell) and the TSP trading rules (one buy per month and transactions have to wait until the next business day's close). I tried a million crosses for the C fund. Buy and Hold had a 356% gain since inception. 100+ crosses beat that but most of them were edge cases that randomly skipped large drops due to how slowly they reacted. Here is a decent cross that had a 380% gain although I don't much confidence in it as it did not react fast enough to avoid the 2019 plunge.

cross.jpg

I hoped that a million crosses would find hidden patterns in the price data. That didn't work out and they don't seem like a good automated trading solution as it is hard to score the results and I had to look at the top 30 charts to pick a decent strategy. I might try the Turtle Trading rules next. Perhaps they still work.
 
Re: EMA/SMA Crosses

image_max.gif


Test:

gif attachment:
cross.jpg

png attachment:
cross.jpg

gif URL:
cross.gif


png URL:
cross.png


cros.png
 
Re: Turtle Trading Rules

ESP, can't get to the link, from work anyway... is there a website, or is it a publication of some kind? We have to be careful of copyrights and posting related content...

At any rate, we have to get you off page one in the MAT list. Come on, folks, roll in on this thread! :cheesy:
 
Turtle Trader

Turtle Trader

I used the Turtle Trader rules with the TSP Trading restrictions. It avoided major drops but only resulted in a 206% gain over twenty years. It missed some obvious runs which leaves me suspicious of my code which came from several old projects that I hacked together. I am going to spend some time cleaning it up to see if I have any errors. It might be interesting to add a net worth graph so people can easily grasp how volatile a strategy is if you are looking at your account value.

P.S. Open the image in a new tab to see the entire twenty years.

turtle.jpg
 
Buy and Hold

I calculated Buy and Hold gains for all funds that existed on 5/31/2003.

Hold.PNG

Small Cap stocks did the best so I will work on strategies for that fund. I added Win Rate, Max Loss and Trades. They don't matter for Buy and Hold but will help in choosing better strategies in the future. I am changing the Backtest engine to use the G Fund for cash so it still grows when not in another fund. Once that is done I will compare some basic Moving Average and Turtle Trader strategies. I expect them to do poorly but the journey of a thousand miles begins with a simple SMA cross.
 
Last edited:
Is Turnaround Tuesday a real thing?

Monday is the best day for TSP Bond funds and the worst day for TSP Stock funds. Tuesday is the best day for Stock funds. So, yes, Turnaround Tuesday is a small but real thing.

stats.PNG
 
Day of the Month Performance

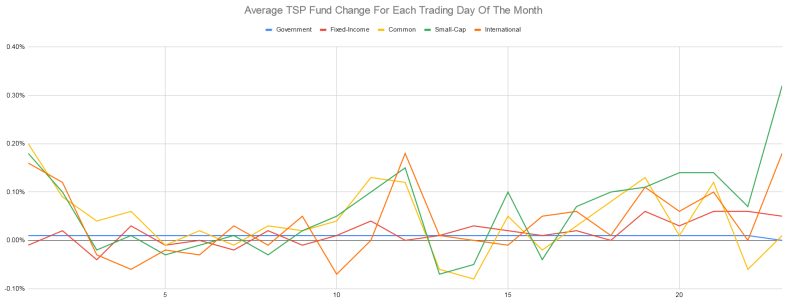
I calculated the average percent change for each trading day of the month. All stock funds tend to drop at the beginning of the month and rise thirteen trading days into the month (OPEX?).

Day Of Month Stats.PNG
 
Day of the Year Performance

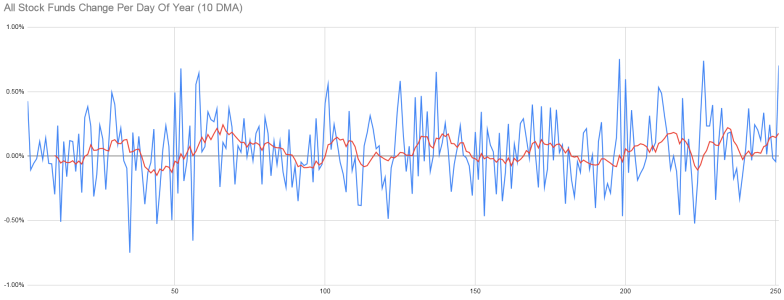
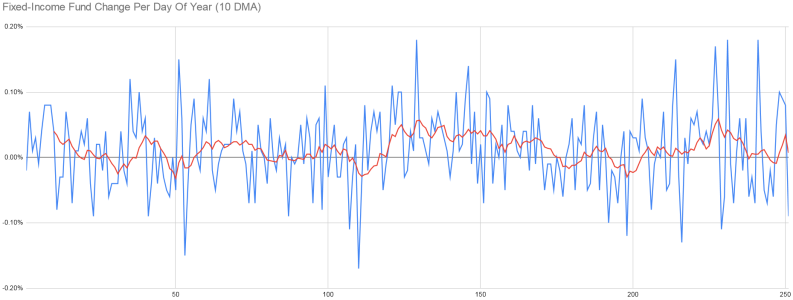
I calculated the average change per trading day of the year for the Stock funds and the Fixed Income fund. They look random with a positive bias. I didn't see anything useful even after adding a 10-Day Moving Average.

Stocks Change Per Day Of Year.PNG

Fixed Income Change Per Day Of Year.PNG
 
Seasonality

I now switch between the G-fund and the Target fund to show more realistic returns. Here are stats for Buy and Hold G-Fund, Buy and Hold S-Fund and the best seasonal period for the S-Fund since 2003. Total Return is the percentage gain, Win Rate is the percentage of trades that were profitable, Max Loss is the largest losing trade and Trades is the number of trades executed.

Seasonal Stats.PNG

The best seasonal strategy was one that avoided the Covid meltdown. That was a unique event that won't happen again (or won't occur in the same time period) so I need to figure out a way to screen out non-repeatable strategies. Anyway, here is the signal chart for this strategy since it is an interesting way to see the trades (open it in a new tab to view the entire twenty years).

Seasonal Signals.jpg
 
Last edited:
Chart Upgrades

I finally had some time to code so I made my charts similar to StockCharts.com (multiple symbols per graph, multiple graphs per chart, variable sized graphs and opaque symbols). I am still looking for an easy-to-read background color. Anyway, now I have what I need to test Sy Harding's Seasonality System from the 90's.

stockcharts.jpg
 
Back
Top