Epic's Account Talk

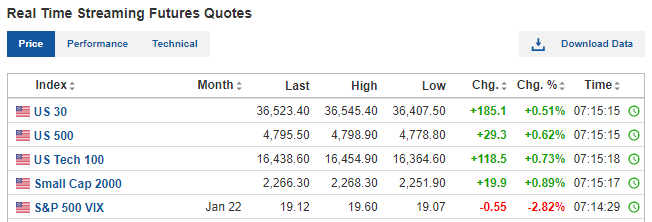
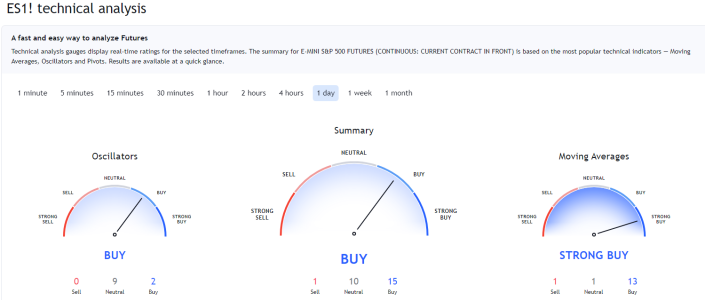
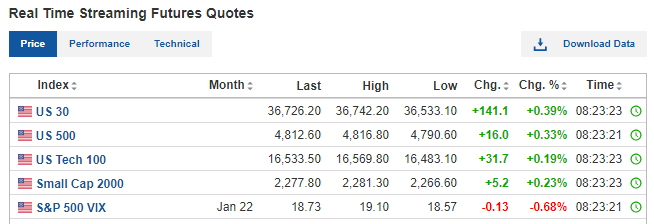
Pretty much the same start as yesterday. Futures are a tad higher, but nothing amazing. (click the links below) Vix is down.
Fear and Greed has gone up to 60 (GREED)
Maybe another flat day?? :dunno:
I'm contemplating how I want to be going into Jan. 2022. Right now I'm 70%S, 30%C with 2 moves left.
What will happen when the Pro's come back into the Market from their 2 week Holiday vacation?
Will they jump on the bandwagon and push things higher, or slam on the brakes?
What's the set-up??? I got nuthin........:eek5:
 
That reading seems to have mixed but mostly positive results with a couple preceding slight pullbacks and others coming near short-term lows, but the market obviously was perky the whole time - except when it preceded the COVID crash. Of course the NAAIM didn't see that coming so it was likely an anomaly.

123021e.gif
 
Well THAT sure was a lot of profit taking at the end of the day. :( I guess everyone's gonna start their Day Drinking super early tomorrow so that they're good and primed for New Years Eve, and just not even be bothered with the Market. :alcoholic:
I'm not even going to try and pretend that I know or understand NAAIM numbers like Coolhand did. My basic knowledge is: Up is GOOD , Down is BAD. Or to expand on that, Upward numbers or graphs means fund managers have been advising their clients to invest, and Downward numbers or graphs indicate those same fund managers are advising their clients to take profit or exit the market to safe haven. At least that's my understanding. I could be totally off base, but I think I'm close.
I don't know how to post the numbers like you did the charts , but the only thing that caught my eye was in the Bullish column, it went from a 200 (last week) down to a 150 (today). It's still Bullish, but just not as strong.
If anyone would like to better explain NAAIM numbers, please feel free. I know there's a bunch of us who'd like to understand them better so we know what we're looking at.
:fest30: Party On Wayne . . . . .
 
In general, the direction of sentiment is a good indication of strength or weakness, but once you get extreme readings on either side, that is usually a fair sign that the move may be close to being over.

Happy New Year to you! :beerchug:
 
So, tomorrow's the first day back for all the pro traders and market managers, all hungover and bloated from the Holidays. So, which way will the market go now that they're back? Flat to slightly negative works for me, which would then give us a nice set-up for a Turnaround Tuesday move in the northern direction with a healthy upward push right at the close of the day. This is all just wishful thinking on my part. =P
It doesn't matter anyway, because I'm quite confident that the winning Powerball Ticket is in my stack of 10 somewhere for that 522 million Jackpot.
Yeah.......right.... :lmao:
 
It doesn't matter anyway, because I'm quite confident that the winning Powerball Ticket is in my stack of 10 somewhere for that 522 million Jackpot.
Yeah.......right.... :lmao:

At least you have a plan. That's the first step. :D
 
This is a note that I documented on what CoolHand said about NAAIM. He mentioned that NAAIM Exposure is smart money=never contrarian as its Smart Money. Money managers are questioned in if they are Long, or Short.

Regarding how to read the NAAIM chart, CoolHand said:
"Let's say that 60 is neutral which it is on NAAiM chart [His post #7685]. The further above that neutral line the number goes, the more bullish the reading. By the same token, the further lower that the number goes below the neutral line, the more bearish the reading. For anyone reading this, don't over-analyze the reading. There is some subjectively involved. All you are trying to do is get a sense of how the smart money is positioned overall. Are they collectively bullish, bearish or somewhere in between?". https://www.naaim.org/programs/naaim-exposure-index/. "I don't agree with their premise that NAAIM exposure is a contrarian indicator except in very short time frames. In fact, if anyone followed that advice when these managers were long (for years) they would have done poorly. Smart money is generally never contrarian. It should also be pointed out that this sentiment reading should not be used all by itself. Other indicators should be used to help validate a market perspective."

Well THAT sure was a lot of profit taking at the end of the day. :( I guess everyone's gonna start their Day Drinking super early tomorrow so that they're good and primed for New Years Eve, and just not even be bothered with the Market. :alcoholic:
I'm not even going to try and pretend that I know or understand NAAIM numbers like Coolhand did. My basic knowledge is: Up is GOOD , Down is BAD. Or to expand on that, Upward numbers or graphs means fund managers have been advising their clients to invest, and Downward numbers or graphs indicate those same fund managers are advising their clients to take profit or exit the market to safe haven. At least that's my understanding. I could be totally off base, but I think I'm close.
I don't know how to post the numbers like you did the charts , but the only thing that caught my eye was in the Bullish column, it went from a 200 (last week) down to a 150 (today). It's still Bullish, but just not as strong.
If anyone would like to better explain NAAIM numbers, please feel free. I know there's a bunch of us who'd like to understand them better so we know what we're looking at.
:fest30: Party On Wayne . . . . .
 
7:20 am - Futures R Up. Gap up with a quick sell-off at the open and then see where we level out at? :dunno: Vix is down almost 3%

CaptureB.PNG

CaptureA.PNG
 
C'mon C-Fund !!!! Just hang on for 15 more minutes. You can do it !!!! Just close above the open. Hang in there !!! :banana::nuts::arms:
 
Back
Top