-
The Forum works well on MOBILE devices without an app: Just go to: https://forum.tsptalk.com
-
Please read our AutoTracker policy on the IFT deadline and remaining active. Thanks!
-
$ - Premium Service Content (Info) | AutoTracker Monthly Winners | Is Gmail et al, Blocking Our emails?
Find us on: Facebook & X | Posting Copyrighted Material
-
Join the TSP Talk AutoTracker: How to Get Started | Login | Main AutoTracker Page
You are using an out of date browser. It may not display this or other websites correctly.
You should upgrade or use an alternative browser.
You should upgrade or use an alternative browser.
DreamboatAnnie's Account Talk
- Thread starter DreamboatAnnie
- Start date
DreamboatAnnie
TSP Legend
- Reaction score
- 1,042
Everything in me is screaming exit on this bounce but...Im staying another day or two...will see.
Best wishes to you all!!

Best wishes to you all!!
DreamboatAnnie
TSP Legend
- Reaction score
- 1,042
S fund

DreamboatAnnie
TSP Legend
- Reaction score
- 1,042
F fund as of now

DreamboatAnnie
TSP Legend
- Reaction score
- 1,042
Last minute.. exited the F Fund and still in C fund 25%. Just barely made it... uggh… who know...maybe tomorrow I will be wishing I had done the opposite and exited C and stayed in F... oh welp! I need a break... hoping the equities hold out. I understand from Fox that there could be news on Nafta with Mexico sometime this week... ??? Hope its good. ")
Oh.. and here is the I fund..... not looking too good, but who knows it could be a buy ...??? I would wait for a up candle with a long down wick indicating that the bulls beat the bears that day.... I fund is in the Support zone now... but nothing says it couldn't drop further... I am out of IFTs for any buy ins. whaaa…...:17:
I fund as of now.

opsey.. not sure how to delete.
Oh.. and here is the I fund..... not looking too good, but who knows it could be a buy ...??? I would wait for a up candle with a long down wick indicating that the bulls beat the bears that day.... I fund is in the Support zone now... but nothing says it couldn't drop further... I am out of IFTs for any buy ins. whaaa…...:17:
I fund as of now.
opsey.. not sure how to delete.
Attachments
Last edited:
DreamboatAnnie
TSP Legend
- Reaction score
- 1,042
Here's a good short article on Yearly Fed meeting this week, and other potential market movers. while Fed chair doesn't speak until Friday, the last Fed minutes get released Wed afternoon.
https://www.msn.com/en-us/money/markets/trade-talks-and-fed-jackson-hole-meeting-could-create-more-than-the-usual-late-august-volatility/ar-BBM4fj6?ocid=spartanntp
https://www.msn.com/en-us/money/markets/trade-talks-and-fed-jackson-hole-meeting-could-create-more-than-the-usual-late-august-volatility/ar-BBM4fj6?ocid=spartanntp
DreamboatAnnie
TSP Legend
- Reaction score
- 1,042
I Exited. 100% G COB. I think it could breakout above January high, but I am going to be conservative and just book what I got this month.
Hoping there are no end of day surprises.... gosh for just once, I would like a clean "up-day" exit.
I wish all of you the Best In your Investments!!!!!!!! :smile:
Hoping there are no end of day surprises.... gosh for just once, I would like a clean "up-day" exit.
I wish all of you the Best In your Investments!!!!!!!! :smile:
DreamboatAnnie
TSP Legend
- Reaction score
- 1,042
Futures are down more than 100 on Dow right now, Will see how it goes tomorrow,,,,hummm….
DreamboatAnnie
TSP Legend
- Reaction score
- 1,042
Here's a good article on using/applying MACD indicator!
https://www.tradeciety.com/tips-how-to-use-the-macd/
https://www.tradeciety.com/tips-how-to-use-the-macd/
DreamboatAnnie
TSP Legend
- Reaction score
- 1,042
DreamboatAnnie
TSP Legend
- Reaction score
- 1,042
Good morning. Another beautiful day... decided this is the song of the morning. Hearing this gets the blood pumping and makes me dance around the kitchen while making coffee and getting ready for work. Take care and wishing we have great market action! 

Yes... Chaka Khan!!
Yes... Chaka Khan!!
DreamboatAnnie
TSP Legend
- Reaction score
- 1,042
Why not???
Check out this video from the 70s... the "groovy" clothes and hair. Love IT!!!!!...
Check out this video from the 70s... the "groovy" clothes and hair. Love IT!!!!!...
DreamboatAnnie
TSP Legend
- Reaction score
- 1,042
This article was posted in a TSP Newsfeed yesterday. Link to article on Market Watch by Sue Chang. But what I found interesting was the last chart in that article, "Average Trading Pattern After A Hgh Made In Augustfor S&P 500... inserted below. Not sure how much weight I will give it, but it indicates when August provides good returns, September tends to follow suit early to mid-month before it drops towards end...while October then provides the larger weakness... hummm……. 
I am trading based on current strategy and technical indicators... but the chart is interesting!
Good evening and Best Wishes to you all!!!!!!!!
https://www.marketwatch.com/story/key-contrarian-indicator-falls-to-9-month-low-as-stock-investors-grapple-with-heightened-global-risk-2018-09-04?siteid=yhoof2&yptr=yahoo
Last edited:
DreamboatAnnie
TSP Legend
- Reaction score
- 1,042
Well been looking at charts this evening... I revamped my charts a bit. Link provides best view.
Using 2 MACDs with settings set at 5,9,2 (used by Grok Trade) and setting 5,9,9 which gives results that are very close to the one that CoolHand is using. Compared them and only minimal differences. Still using Full (or Slow) Stochastic and do show RSI although still do not use (need to learn more about it).
Also made some changes to Moving Averages. Using EMAs 3, 5 EMAs and SMAs 10,50,100. Bollinger Bands shown in chart with the mid-point (dotted line representing a 20 day SMA)
I tend to like the 5,9,9 most.
C FUND - LINK - $SPX | SharpChart | StockCharts.com
Last edited:
DreamboatAnnie
TSP Legend
- Reaction score
- 1,042
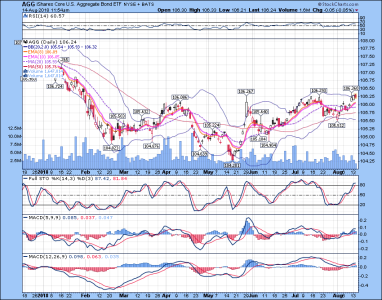
Here are the remaining links to charts.
S FUND (DWCPF)- $DWCPF | SharpChart | StockCharts.com
I FUND - (EFA) EFA | SharpChart | StockCharts.com
F FUND - (AGG) AGG | SharpChart | StockCharts.com
S FUND (DWCPF)- $DWCPF | SharpChart | StockCharts.com
I FUND - (EFA) EFA | SharpChart | StockCharts.com
F FUND - (AGG) AGG | SharpChart | StockCharts.com
DreamboatAnnie
TSP Legend
- Reaction score
- 1,042
A little morning dance...and why not... it's Friday... woooo.hoooo…
Last edited:
DreamboatAnnie
TSP Legend
- Reaction score
- 1,042
Looks like it's getting close to a buy (looking at those daily 4-month charts posted yesterday). But not yet, if we get a pop today, it might be enough to trigger a buy for me.....but not yet. Gosh, I feel like jumping in now but I am going to wait … follow strategy. Patience.... :worried:
I hope you all have a Great Weekend!!!
Best Wishes on your Investments!!!!! :smile:
I hope you all have a Great Weekend!!!
Best Wishes on your Investments!!!!! :smile: