DreamboatAnnie
TSP Legend
- Reaction score
- 1,040
Entered 50G, 20S, 20C, 10I. Best wishes to all!
The Forum works well on MOBILE devices without an app: Just go to: https://forum.tsptalk.com
Please read our AutoTracker policy on the
IFT deadline and remaining active. Thanks!
$ - Premium Service Content (Info) | AutoTracker Monthly Winners | Is Gmail et al, Blocking Our emails?
Find us on: Facebook & X | Posting Copyrighted Material
Join the TSP Talk AutoTracker: How to Get Started | Login | Main AutoTracker Page
")
thanks! been missing your chartsGood evening,
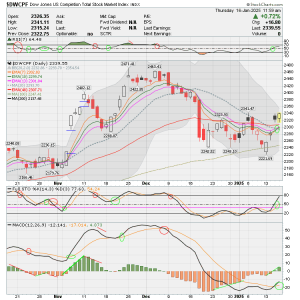
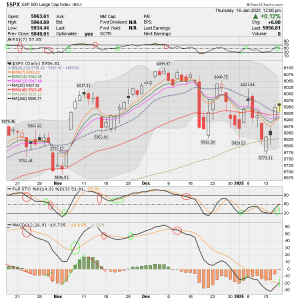
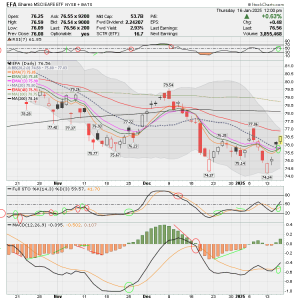
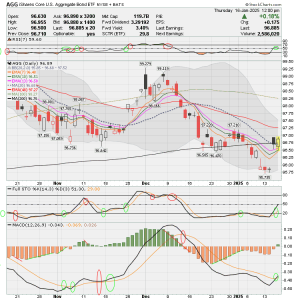
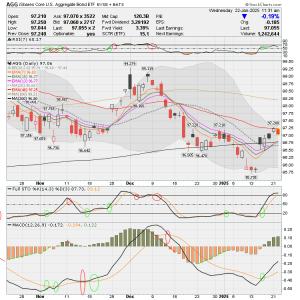
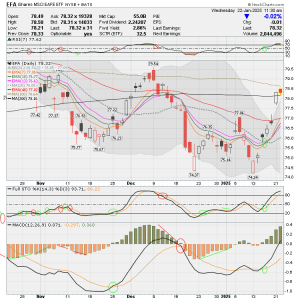
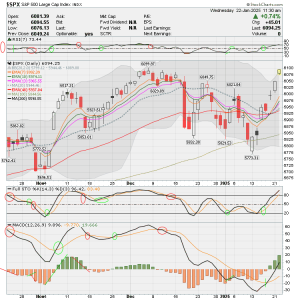
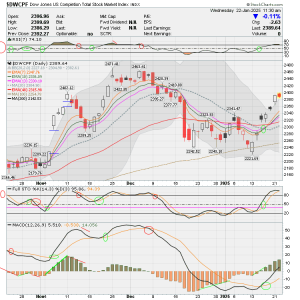
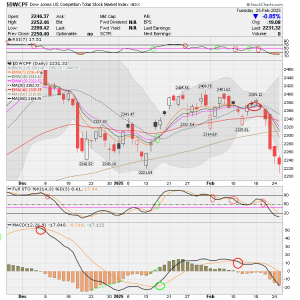
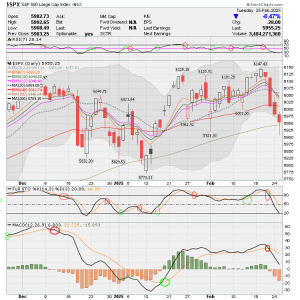
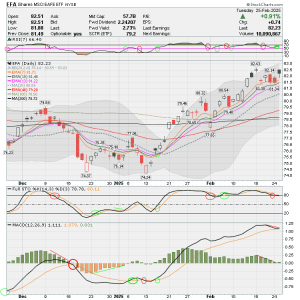
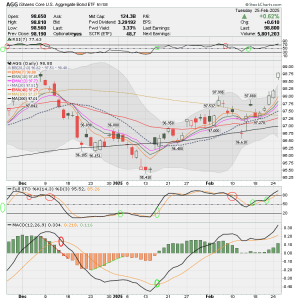
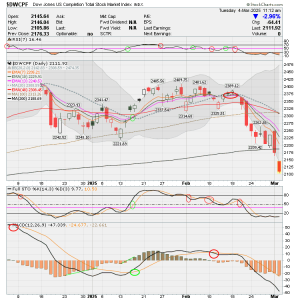
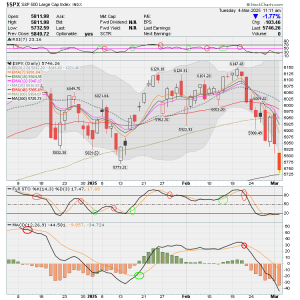
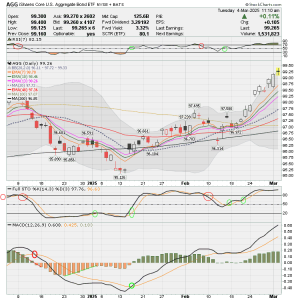
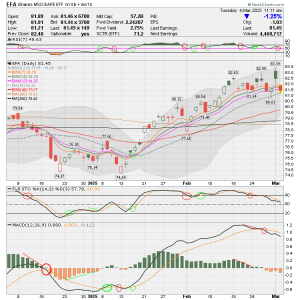
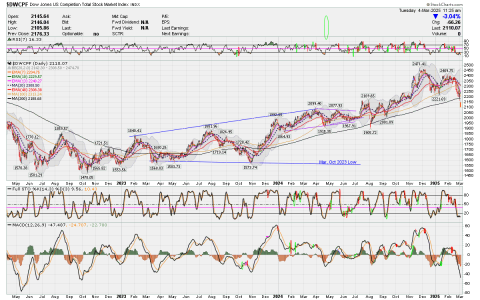
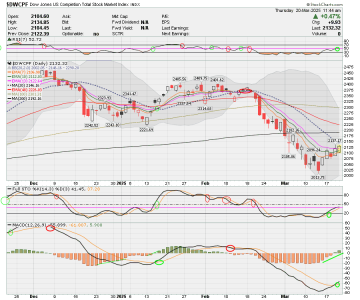
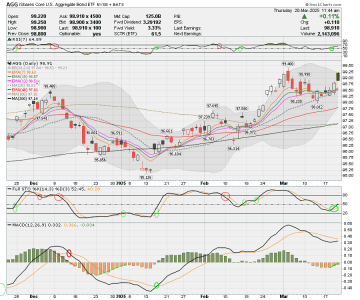
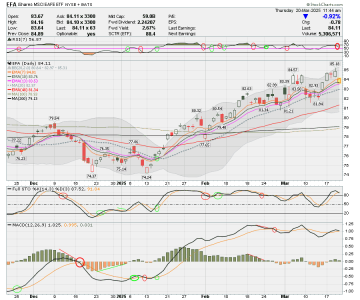
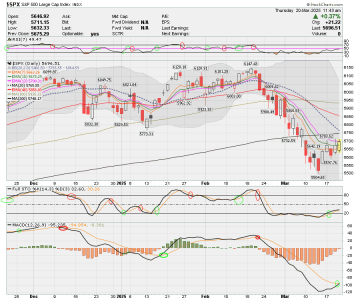
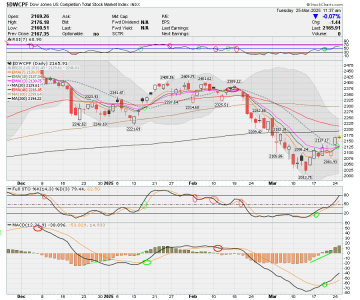
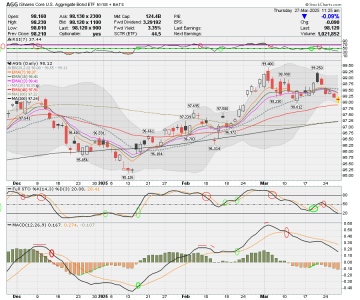
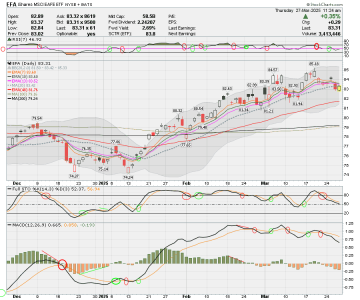
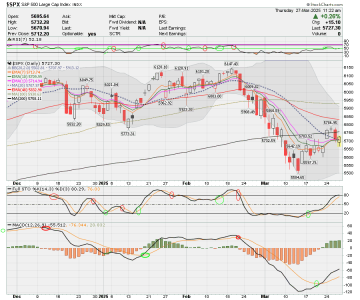
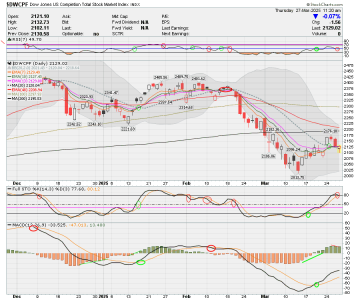
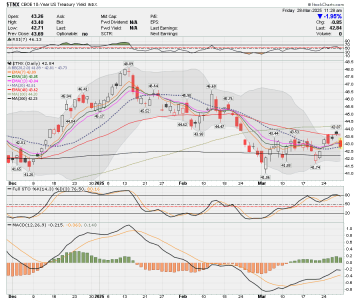
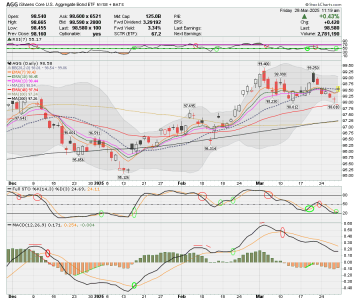
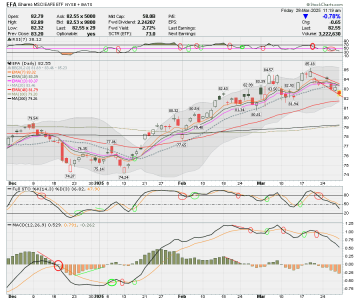
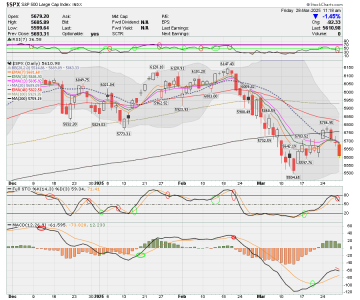
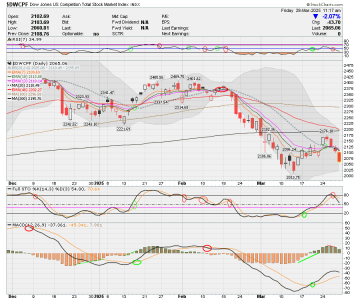
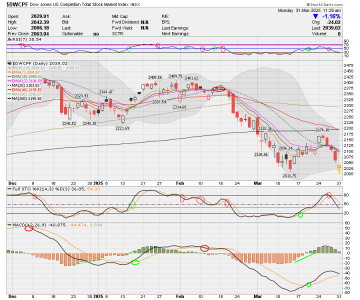
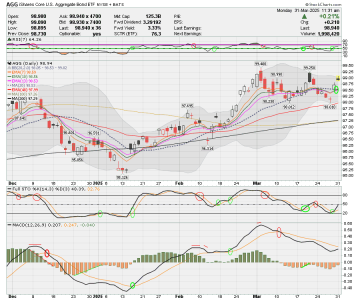
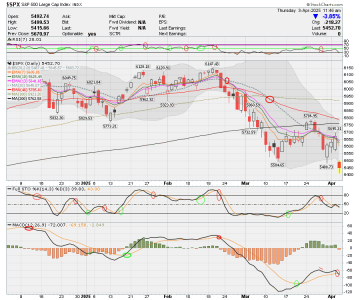
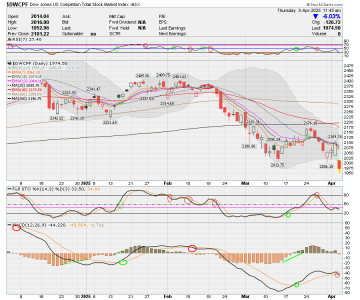
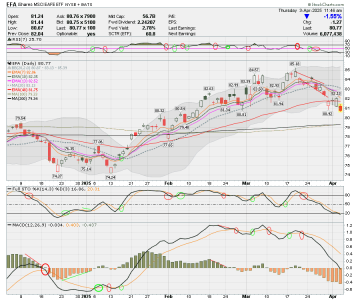
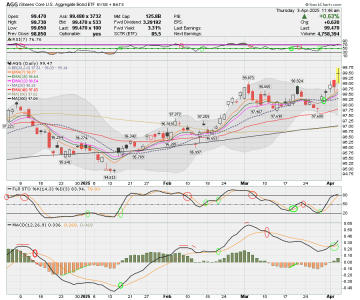
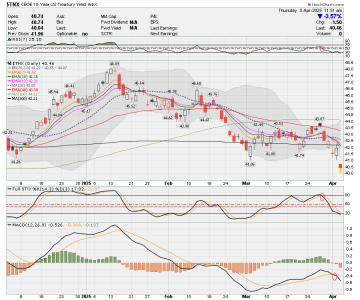
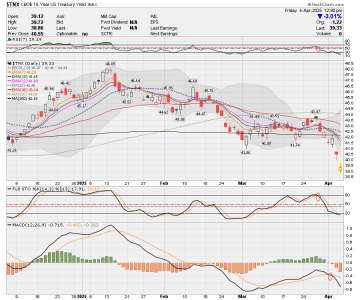
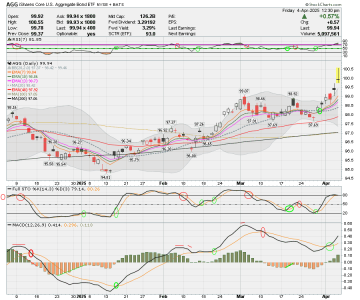
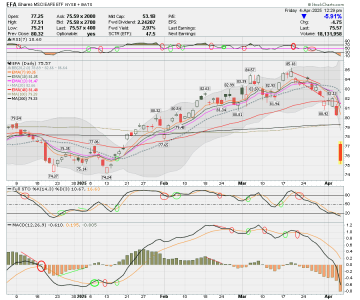
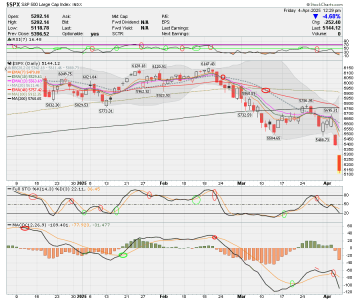
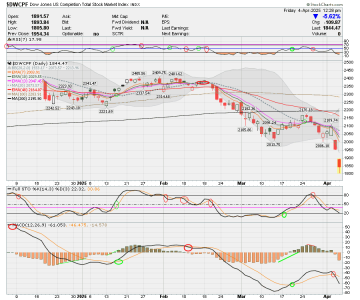
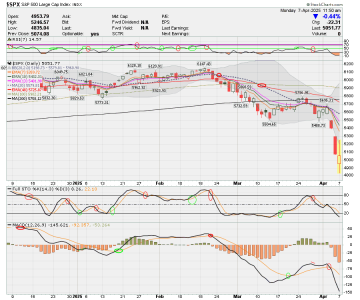
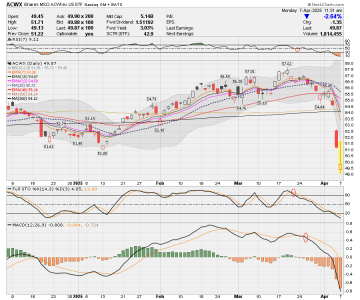
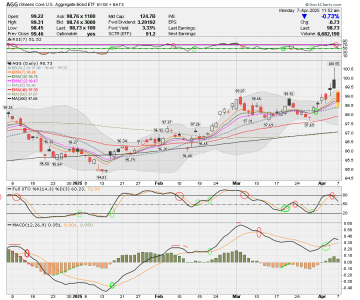
Posting COB charts. Hope to post more regularly.

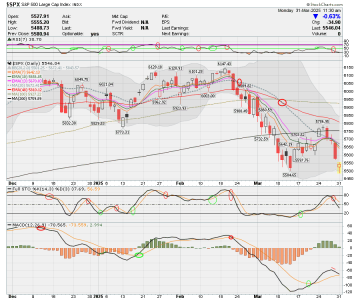
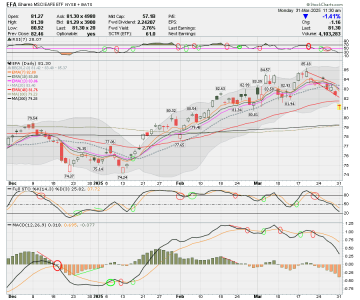
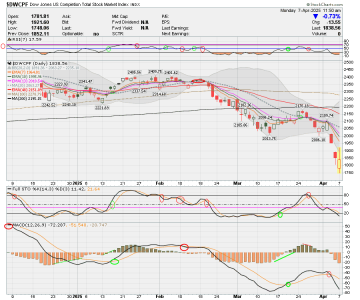
Ouch that C-Fund MACD Histogram Bar goes back to the COVID lows, which I believe makes this the 2nd lowest ever (going back to 1871)Monday Charts before noon cut off. moving my 25% from F to G fund. Best wishes