-
The Forum works well on MOBILE devices without an app: Just go to: https://forum.tsptalk.com
-
Please read our AutoTracker policy on the IFT deadline and remaining active. Thanks!
-
$ - Premium Service Content (Info) | AutoTracker Monthly Winners | Is Gmail et al, Blocking Our emails?
Find us on: Facebook & X | Posting Copyrighted Material
-
Join the TSP Talk AutoTracker: How to Get Started | Login | Main AutoTracker Page
You are using an out of date browser. It may not display this or other websites correctly.
You should upgrade or use an alternative browser.
You should upgrade or use an alternative browser.
DreamboatAnnie's Account Talk
- Thread starter DreamboatAnnie
- Start date
DreamboatAnnie
TSP Legend
- Reaction score
- 854
Your Welcome Ravensfan! :smile:
DreamboatAnnie
TSP Legend
- Reaction score
- 854
DreamboatAnnie
TSP Legend
- Reaction score
- 854
DreamboatAnnie
TSP Legend
- Reaction score
- 854
DreamboatAnnie
TSP Legend
- Reaction score
- 854
DreamboatAnnie
TSP Legend
- Reaction score
- 854
DreamboatAnnie
TSP Legend
- Reaction score
- 854
DreamboatAnnie
TSP Legend
- Reaction score
- 854
DreamboatAnnie
TSP Legend
- Reaction score
- 854
Hi MMK,
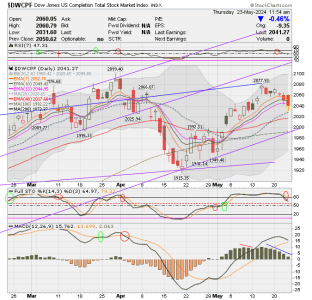
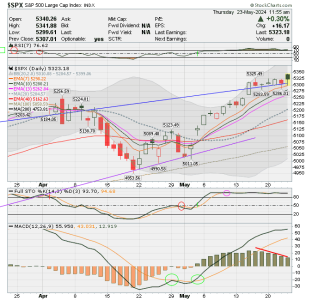
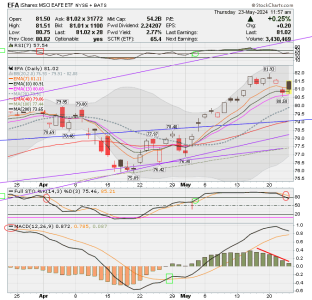
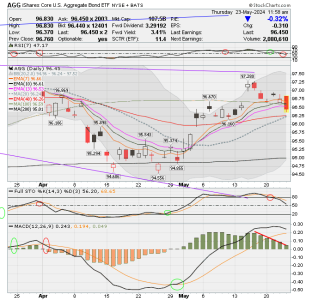
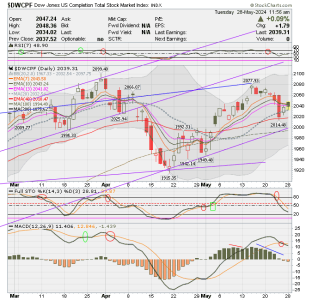
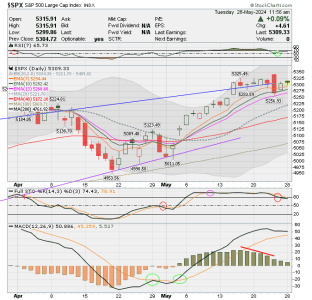
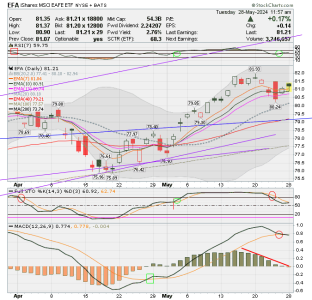
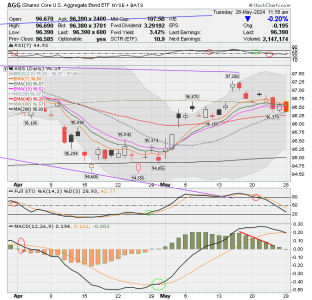
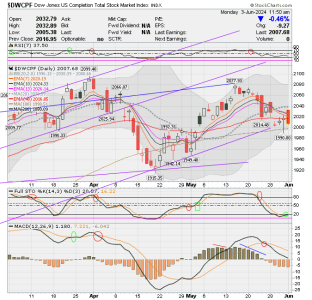
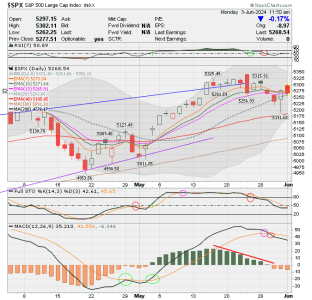
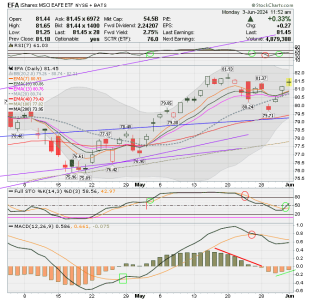
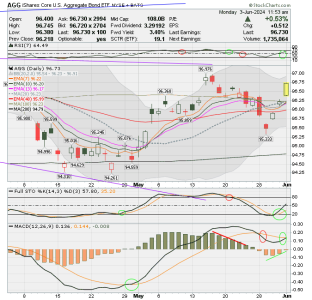
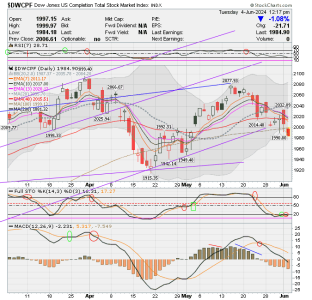
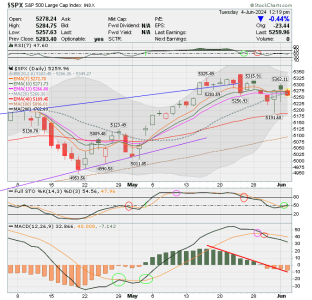
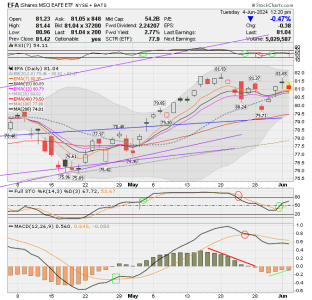
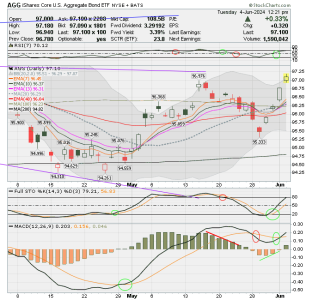
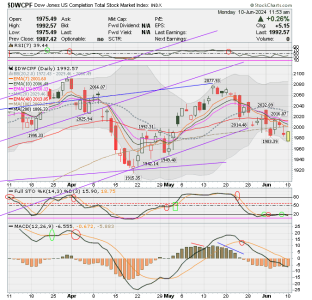
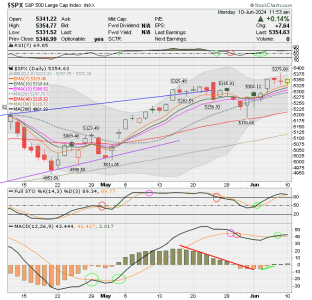
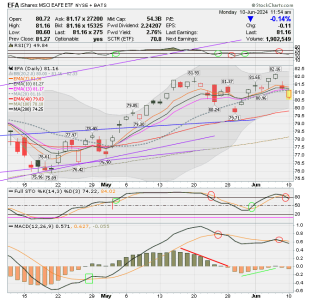
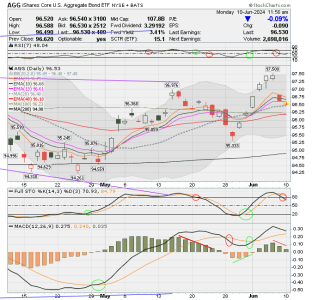
The reason I use the 7, 10, 13 and 48 day EMAs is because there was a study some years back that showed that a cross over of the 13 over or under the 48.5EMA was the best cross over for a long-term strategy that gave you the most earnings. I personally like the 7 and 10 days cross overs since I like a shorter-term strategy for entry and exit. There are so many things to consider it can be over whelming but I do like to see at least two of three indicates being positive... such as RSI going above 50 and Stochastic moving above 20 at the same time.
MACD is a bit slow to rely on for entry, but it is a good indicator to get you out as a drop dead exit point. I also look at MACD historgram bars... to show momentum.
Best wishes to you! :smile:
DreamboatAnnie
TSP Legend
- Reaction score
- 854
DreamboatAnnie
TSP Legend
- Reaction score
- 854
DreamboatAnnie
TSP Legend
- Reaction score
- 854
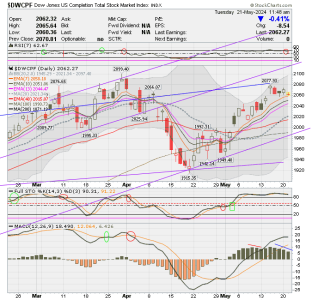
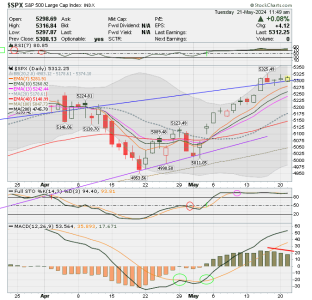
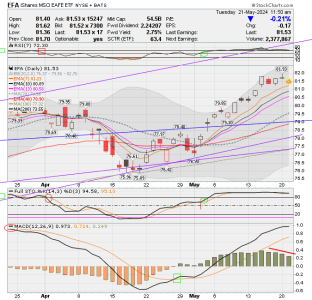
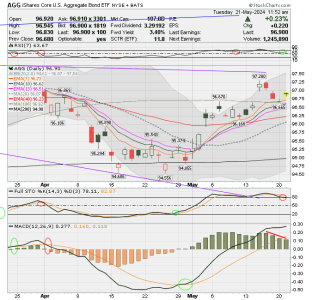
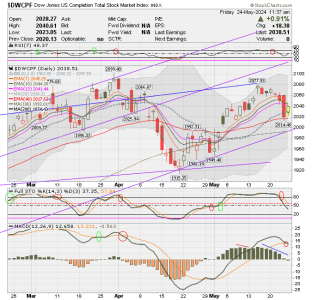
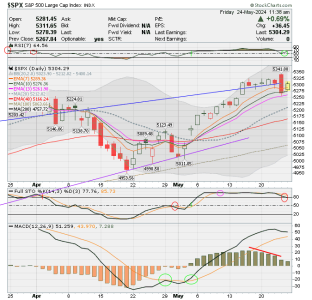
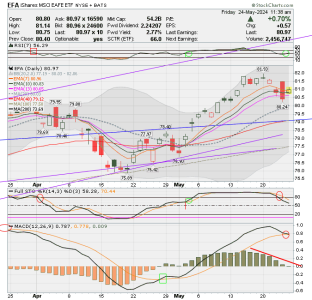
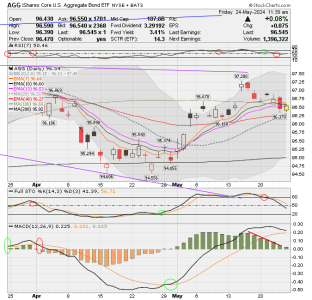
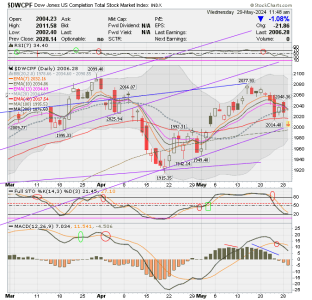
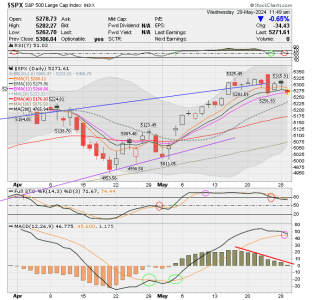
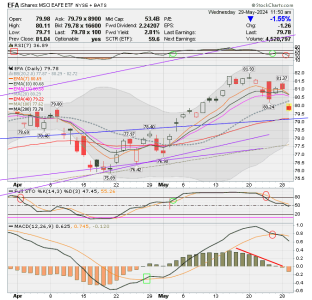
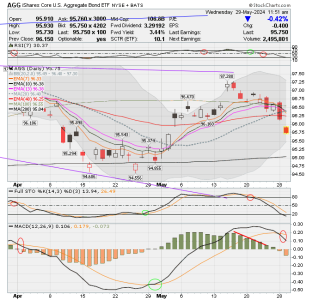
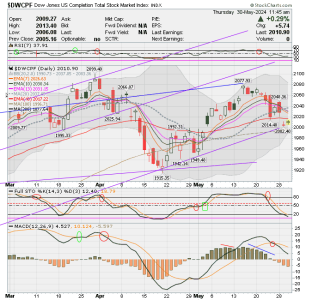
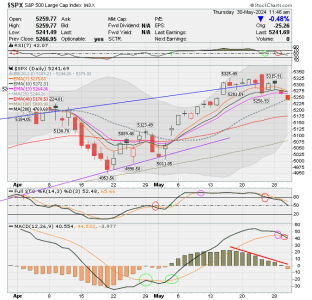
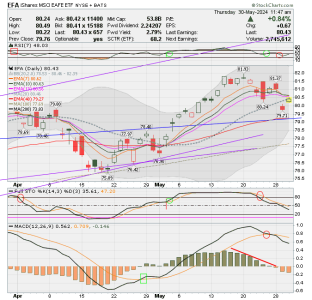
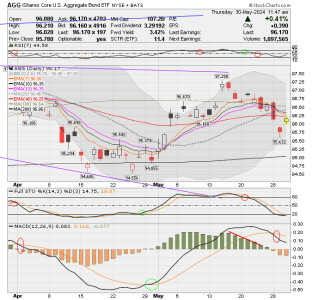
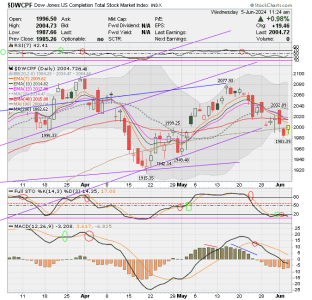
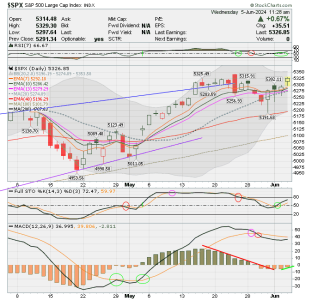
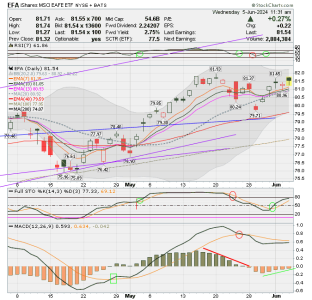
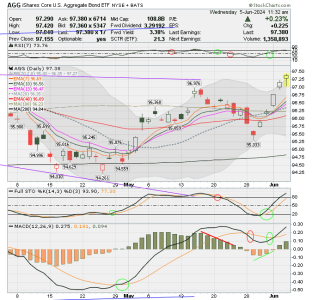
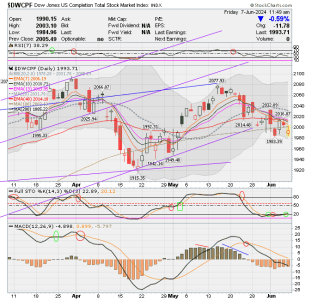
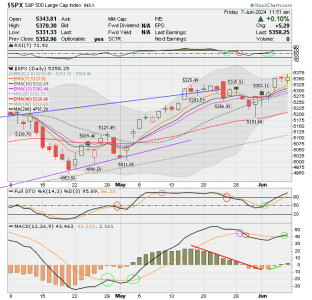
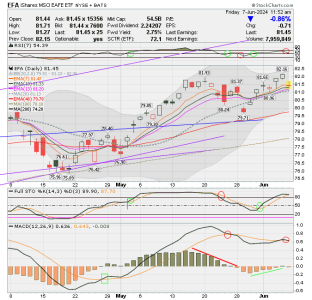
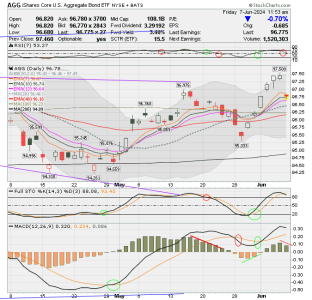
Hi, Here are charts before cut off. No entry. Just as FYI, Ravensfan likes to use his crystal ball which is looking at 10 and 20 EMA cross over and paying particular attention to movement towards each other or moving further apart to consider entry/exits. I like that strategy!
Best wishes to you all! :smile:
Best wishes to you all! :smile:


DreamboatAnnie
TSP Legend
- Reaction score
- 854
DreamboatAnnie
TSP Legend
- Reaction score
- 854
You know Whipsaw... I just hate when that happens! 

