DreamboatAnnie's Account Talk

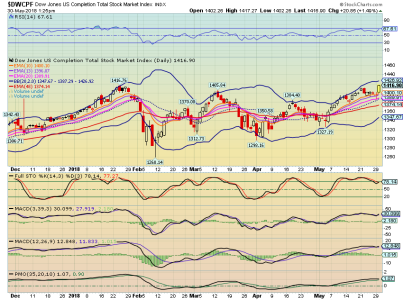
It was really hard to exit today. I wanted to stay in because market looks hot and with China tariffs on hold, just looked very good. But looking at intraday candle formation (just before noon) and seeing that DWCPF is right at January high level (resistance) as it already broke through the March high, I thought it best to take my few gains and get out. Plus I need a breather. Of course, in the back of my mind I am thinking, if I exit it will skyrocket tomorrow.... lol.. Now looking at the candle at 1:25pm ET, it is looking even better and does look like it could now break out.

Well this time, instead of going with my feelings to stay in based on the "news", I stuck with what I saw on chart intraday and moved on it. The price is doing great right now!! Out of IFTs so I will now just say ribit ribit as I sit on the Lilly pad… and I am quite HAPPY to just sit here for now. No... I do not want to know what it does for the next 9 days, but of course I will peek.... :rolleyes:
LOVE
Best Wishes to you all!!!!!!!!! :smile:

Hey.... maybe I'll listen to some great tunes while I sit here. Oh... and I forgot to mention that I did get to see Dwight Yoakum on Mother's day weekend at a Great outdoor amphitheater just North of San Antonio and due West of New Braunfels at Canyon Lake. So laid back with outdoor bar, picnic tables and food booths in the back... we sat in a pavilion with fairly good view but the best part was that we could dance, sit and drink Blue Moon! Nice breeze in the evening made the event very relaxing. He played his hits, some Meryl Haggard and ended with Suspicious Minds. Nice!! I loved seeing all the guys in their cowboy hats, jeans and boots... wooo… hooo…. :D ... I love Texas!!!
 
Last edited:
Good morning, Wow... yesterday's down day was a bit surprising and then not. I wondered when European issues would again rock us on this side of the pond. I really thought we would break out soon to the upside since we had started to exceed prior month highs (except for Jan). So not sure if we must hit reset or not.


Oh .. on to another topic. Someone had observed that many folks are not posting any longer. We have lost some folks that were big in posting over the last few years and that is regrettable. But there are still many here to could possibly start posting more regularly and I hope they an be encouraged to do so. I would hope so. I used to post lot but quite honestly with how I am doing this year, I don't want to say a lot so as to not lead someone down a rabbit hole with me.


But you know how sometimes your Phone does not receive messages because you need to maybe restart it (since it is basically a little computer), and then once you reset you get a flood of messages. Well... I am kinda in that boat. Resetting my strategy and hoping to get back in sync. Yesterday read one good article in the afternoon and then two late last night plus two this morning. So getting back in the swing of things.... plus feeling better since I properly times and exited at the top of this last upward move...courtesy of some new Grok Trade information.


What I have loved lately is the GrokTrading videos that Nnutt posts (Thank you so much!!!). I especially like D7 and the weekend analysis he does. I have been trying to figure how he draws his line and after a month or so, I think I am starting to figure out some of how he does that.... though he does mention that he only shows one set of lines... nonetheless helpful. He provides training on the trading the market (mentoring). I am thinking it is probably very costly but what I have been learning from just watching every video and it is pretty good.


He seems to concentrate the most on support resistance lines of all types, plus some candle reading as well as looking at MACD and volume. He also posts his buy and sell signals so it can clue you in to his view of indexes (SPX, Dow, Russell). He uses the Spyder indexes for his charts and I love his charting software. I like that he can move lines so easily. He uses monthly, weekly and daily charts. This is different from my last strategy since mine was primarily EMAs, Bollinger bands, MACD and Slow Sto. Sol I am hoping that with a different type strategy, my moves could improve.... crossing fingers.

Also, with regard to charting software, I had been thinking to move away from Stockcharts because I have such a hard time drawing lines, and keeping them. Maybe I just haven t yet figured out how to use the drawing tools but Im pretty good with computers and software so I am not sure about this. Seems difficult and I want something easy. So might look at what Grok uses for his charting. He has referred to it once and I think he names it on his site.

Ok.. so I have been a bit chatty today. I have done my damage for the day.

I hope you have a great day and Best Wishes on your Investing!!!!!!!!! :smile:
 
Yes Grok is at the top of my list, I always watch his whole video. There are others that I consider as really good and giving us some useful information.
Thanks for the ATTABOY!!:D
 
DBA, I think we're in the same place. I've been watching Grok and Right side of the chart, which has helped; though the RSOTC is very risk averse and looking for a large decline. Grok is good, though he doesn't always put out a video, and seems to coincide with decision points, so, like you, I need to tighten up my own analysis. Sidelined for the time being till I get a grip on things, the volatility is certainly challenging.
 
S Fund is looking best. Check out today action so far...yellow candle as of now. Price has broken through Jan high by just a tad....will it go higher tomorrow? looking very good....:D
fresh IFTs or me on Friday....will see.... remember Fed meets around June 13... monkey wrench possible....oh yes and Grok trade mentioned issues in financial sectors.....are not good and this sector is like a leading indicator for market... so be careful...

S fund as of 5-30-2018.png
 
Well Fox Business News just announced that Wilber Ross stated they will not give the EU a break on the 25% tariff on steel and aluminum (that takes effect) this Friday. Market was at +290 on DOW when announced and it moved down a bit and went back up within a few minutes. No telling what happens in the next 10 minutes. Also Ross is reported to be going to China June 2-3. Humm……

P.S. Dow is at 289 so not having any big impact at this point.....
 
Humm.... so market continues downward... gained 3/4 back yesterday but now down 195 pts on Dow. I get my IFTs tomorrow. If I had one, I might buy a little S but pretty sure I would avoid I fund !!! Then again... I have been off the mark this year so take that with a grain of salt and shot of tequila! :)

But then I think... will I buy in tomorrow? Probably not... but that's just me. I am a bit queasy about Wilbur going to talk to China this weekend on Tariffs. I am thinking better to wait until Monday... If its bad news market would be better priced (lower). If not.... well.... please give me another shot!
 
Market is nicely up at this time... good bit of coin for anyone that entered yesterday. S fund up .72% right now... very nice!

I noticed the Bollinger Bands are starting to constrict for both the S and C fund... usually indicates sideways movement and sometimes drops. Just saying.....

Best Wishes to everyone on your Investments!!!!!! :smile: Hope you have a great weekend!!! :D


P.S. Not sure why but I think I am missing some emails, but when I send to self, I get them... kinda weird. I know.. nothing to do with market but I just need to vent a bit.... :(
 
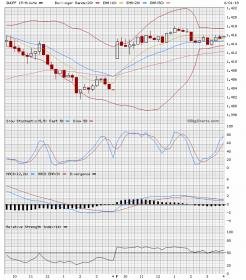
Here is a link to an INTRADAY chart for the DWCPF chart, which the S Fund is supposed to track. This chart is via Bigcharts.com. I've always loved Bigchart…. and the best thing is that it's TOTALLY FREE ! I set this chart to show price, intraday in 15 minute intervals. But when you get to the link, you can change this under the timeframes section...1 To 5 days allows frequency of 5 and 15 minute, and hourly candles. Or you can select larger timeframe to see daily, weekly monthly charts and reset technical indicators. This link will auto refresh each time you click the link, but when looking intraday, it only updates every 20 minutes. For Intraday, I use my Stock charts subscription as it updates with less than 1 minute delay.


To change to different chart, enter desired chart symbol under place where it says, "Advanced Chart" and hit Draw Chart.

C Fund tracks SPX
I fund tracks EFA
F fund tracks AGG

S&P 500 Index, SPX Advanced Chart - (SNC) SPX, S&P 500 Index Stock Price - BigCharts.com
 
Last edited:
oh yes...one more thing... for I fund you should use $IEE for charting, but I still like EFA (similar but its an ETF) because you can see volume.
 
Here are some good articles on China tariffs. Primary take away....announcement dates may affect markets ...so good to keep in mind in case entering or exiting and news hits after your noon IFT submission.

June 15th - Final Tariffs List announced - 25% on Chinese imports containing Advanced Technologies, including those related to China's Made In China 2025 Development Program. Take effect shortly thereafter

June 30th - New investment limits to be announced, take effect shortly thereafter. Investment restrictions and export controls for Chinese acquisitions of industrially significant technologies


https://thediplomat.com/2018/06/brace-yourselves-the-us-china-trade-war-is-about-to-begin/

https://www.denverpost.com/2018/05/29/trump-china-tariffs-details/
 
Last edited:
oh yes...one more thing... for I fund you should use $IEE for charting, but I still like EFA (similar but its an ETF) because you can see volume.
I have been using the $IEE lately, but Tuesday's StockCharts quote had a bad "tick" on it and the bar was huge, so I went with EFA today.

060518d.gif
 
Hi, I saw that too. As of late, I've been trying to see which of the two comes closest to hitting the TSP earnings percentage. Seems $IEE is closest but today I think they were both way off... :(

IEE was -.11%
EFA was -.16%
TSP= -.44%
 
Big leap off the Lilly Pad!! Geronimo! 80S, 20C Eff COB today.

S fund still looks best. I also like I fund but when I looked at Weekly Charts, it scared me off.....

Best Wishes to Everyone on your Investments!!!!!!! :smile:
 
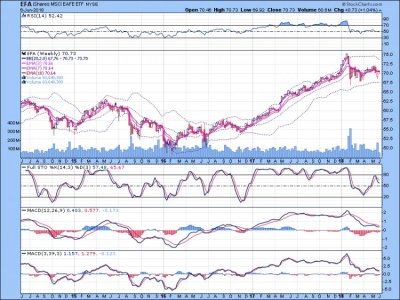
Heres a look at the WEEKLY EFA chart (for I fund). This is why I didnt put any into that fund. Looks to be turning down. I also heard Ira Epsteins video this evening and he mentioned one CB economist saying QE is getting cut and also its expected to start getting cut in Septemer??? Hummm....Slow Stochastic and MACD moving down and below their signal lines, mid-point line of Bollinger Bands starting to slope down....eeeeekk! :(

image.jpg
 
Big leap off the Lilly Pad!! Geronimo! 80S, 20C Eff COB today.

S fund still looks best. I also like I fund but when I looked at Weekly Charts, it scared me off.....

Best Wishes to Everyone on your Investments!!!!!!! :smile:

Looks like you need to update your sig line to reflect this IFT.
 
Back
Top