At the beginning of last week, the Top 50 were sporting a total stock allocation of 100%. That was the first time this year that they had complete exposure to stocks at the beginning of a trading week. But the market did not reward that level of exposure as the S fund fell 2.57%, while the C fund dipped only 0.98%. Of course, more than 96% of their stock exposure was in the S fund, so the Top 50 got hit rather hard overall.
This week, the Top 50 have lightened up a bit. Here's the charts:
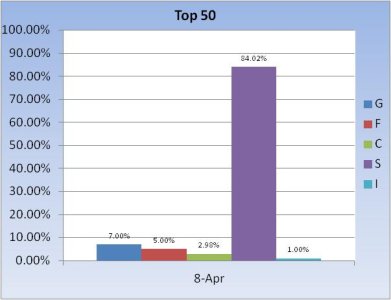
This week, the Top 50 reduced overall stock exposure by 12%, going from 100% exposure last week to 88% exposure this week. Last year, a drop in stock exposure by more than 10% usually meant higher stock prices for that week.
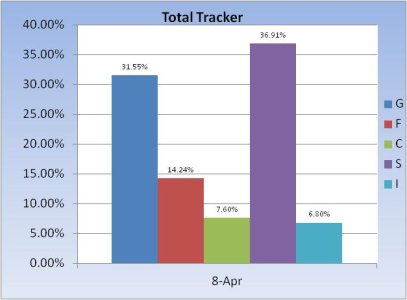
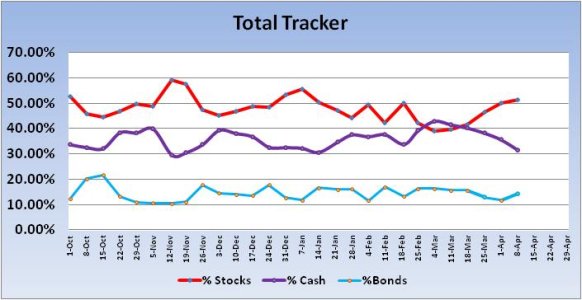
The Total Tracker showed another increase in stock exposure (5th week in a row). This group increased total stock exposure from 50.04% last week, to 51.31% this week. Not a big jump and still conservative overall.
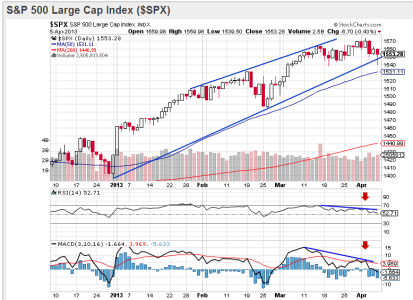
Looking at the S&P, we can see price has been tracking sideways since mid-March. I note that during this time both RSI and MACD have been falling and continue to appear to be pointing lower. I also note that while price remains in that upward trending channel, it did poke below the channel intraday on Friday. So we could be poised for some upside action early next week given support held.
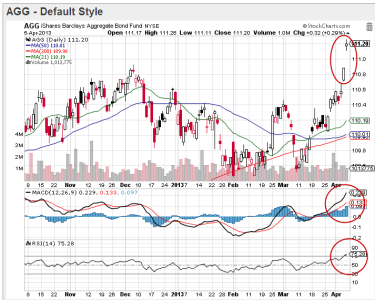
I don't normally pay a lot of attention to bonds (mainly because the charts tend to be somewhat boring), but the action the past week, and especially Friday have me wondering about market character. On Friday we can see that AGG gapped higher and sliced through resistance easily. MACD is showing a lot of upside momentum, while RSI is showing strength, albeit it is overbought at the moment. But overbought can get a lot more overbought before strength subsides. I find this chart a bit troubling because it suggests fear. We have a situation where monetary policy is very accommodative (or at least has been), while the bond market appears to be running for cover. Is it simply the last jobs report information, or something more? The North Korea situation? I don't know, but this chart seems to be telling us something.
Overall, this market has managed to remain resilient in spite of an intermediate term sell condition. This could go on for awhile yet. Our sentiment survey came in at 35% bulls vs. 56% bears, which is a buy signal. So I'd have to expect price to remain resilient, although I'm thinking volatility may increase. I'm looking for strength early in the week, but we're going to probably see some weakness by mid-week. I'll anticipate higher prices overall by week's end given the Top 50 dropped their stock exposure by 12%.
This week, the Top 50 have lightened up a bit. Here's the charts:

This week, the Top 50 reduced overall stock exposure by 12%, going from 100% exposure last week to 88% exposure this week. Last year, a drop in stock exposure by more than 10% usually meant higher stock prices for that week.


The Total Tracker showed another increase in stock exposure (5th week in a row). This group increased total stock exposure from 50.04% last week, to 51.31% this week. Not a big jump and still conservative overall.

Looking at the S&P, we can see price has been tracking sideways since mid-March. I note that during this time both RSI and MACD have been falling and continue to appear to be pointing lower. I also note that while price remains in that upward trending channel, it did poke below the channel intraday on Friday. So we could be poised for some upside action early next week given support held.

I don't normally pay a lot of attention to bonds (mainly because the charts tend to be somewhat boring), but the action the past week, and especially Friday have me wondering about market character. On Friday we can see that AGG gapped higher and sliced through resistance easily. MACD is showing a lot of upside momentum, while RSI is showing strength, albeit it is overbought at the moment. But overbought can get a lot more overbought before strength subsides. I find this chart a bit troubling because it suggests fear. We have a situation where monetary policy is very accommodative (or at least has been), while the bond market appears to be running for cover. Is it simply the last jobs report information, or something more? The North Korea situation? I don't know, but this chart seems to be telling us something.
Overall, this market has managed to remain resilient in spite of an intermediate term sell condition. This could go on for awhile yet. Our sentiment survey came in at 35% bulls vs. 56% bears, which is a buy signal. So I'd have to expect price to remain resilient, although I'm thinking volatility may increase. I'm looking for strength early in the week, but we're going to probably see some weakness by mid-week. I'll anticipate higher prices overall by week's end given the Top 50 dropped their stock exposure by 12%.
