It seems like it's been forever, but the big moment we've been waiting for the past several months is finally here. That would be the Presidential election, which will occur Tuesday. I think most would probably agree that regardless of who is elected for the next 4 years the market will almost certainly react, and quite possibly in a big way even if it's only for the short term.
So how are we positioned for this event? Perhaps not surprisingly we're not far from evenly split between cash/bonds and stocks. Neither group made any major adjustments for the new week. Here's the charts:
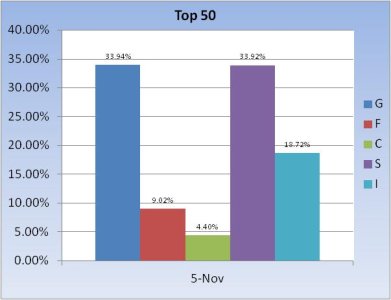
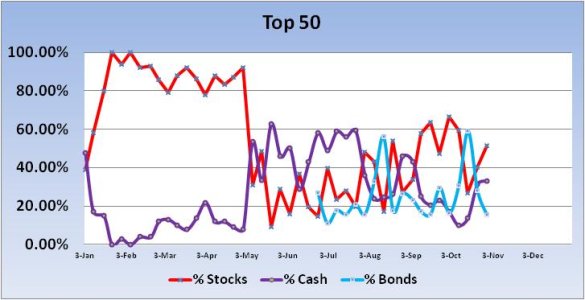
Last week, the Top 50 increased their collective stock exposure by 11%. The market responded, albeit in volatile fashion, with a gain of 0.86% in the S fund, but only 0.18% for the C fund.
This week, they've increased their stock allocations by 5.6% to a total stock allocation of 57.04%.
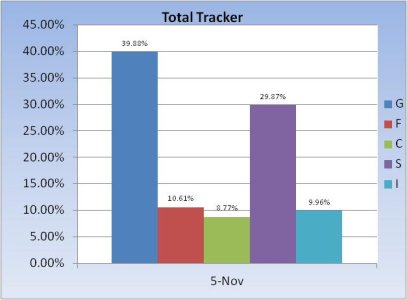
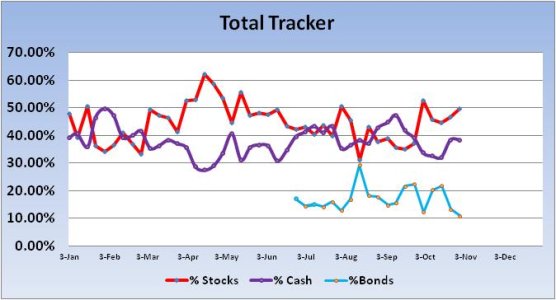
The Total Tracker has not seen a big move in stock allocations (more than 5%) since the week of October 8th. So total stock allocations have remained in a relatively tight range. For the new week, we've trimmed stock allocations a bit from a total of 49.7% last week, to 48.6% this week. The S fund remains the fund of choice for most TSPers holding any stock allocations.
Our sentiment survey flipped to a sell condition for this week with a reading of 60% bulls to 30% bears. That's too bullish, but this isn't a typical week either, so I'm not sure I'd hang my hat on this reading.
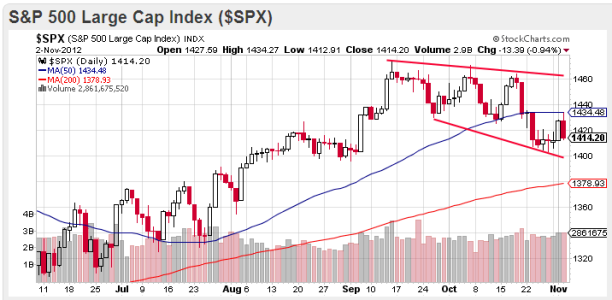
Thursday's action saw the S&P rally nicely, but it ran into resistance after tagging the 50 dma and fell back to close below it. And then Friday erased most of those gains.
So it would seem the market is poised for a big move this week if for no other reason than Tuesday's election. But which direction might that be (and for how long)? Whichever way it goes, we collectively have the bases covered.
So how are we positioned for this event? Perhaps not surprisingly we're not far from evenly split between cash/bonds and stocks. Neither group made any major adjustments for the new week. Here's the charts:


Last week, the Top 50 increased their collective stock exposure by 11%. The market responded, albeit in volatile fashion, with a gain of 0.86% in the S fund, but only 0.18% for the C fund.
This week, they've increased their stock allocations by 5.6% to a total stock allocation of 57.04%.


The Total Tracker has not seen a big move in stock allocations (more than 5%) since the week of October 8th. So total stock allocations have remained in a relatively tight range. For the new week, we've trimmed stock allocations a bit from a total of 49.7% last week, to 48.6% this week. The S fund remains the fund of choice for most TSPers holding any stock allocations.
Our sentiment survey flipped to a sell condition for this week with a reading of 60% bulls to 30% bears. That's too bullish, but this isn't a typical week either, so I'm not sure I'd hang my hat on this reading.

Thursday's action saw the S&P rally nicely, but it ran into resistance after tagging the 50 dma and fell back to close below it. And then Friday erased most of those gains.
So it would seem the market is poised for a big move this week if for no other reason than Tuesday's election. But which direction might that be (and for how long)? Whichever way it goes, we collectively have the bases covered.
