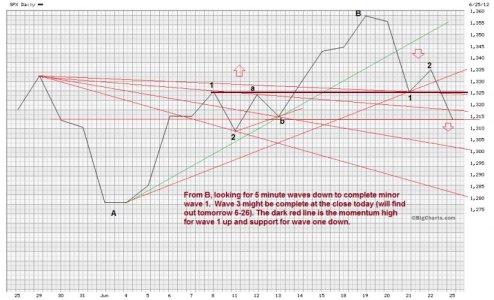
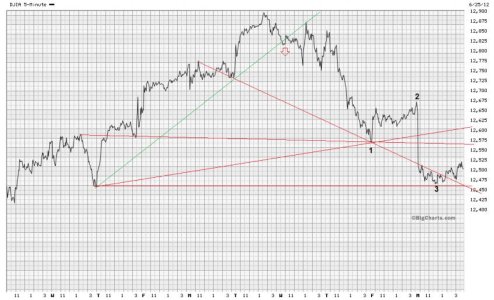
The line chart shows the SP 500 daily closes for the last month. We see the climb from A to B, and the simple wave form. Starting on the left, there is a rise to 1, pullback to 2, a contracting triangle (a, b) and breakout to B at the high. Starting down since last Thursday, we see support at 1, bounce to 2 and a failure toward what will be 3 and may already be in, as seen on the 5 minute DOW chart. After two more little waves to complete five, fibonacci target areas point towards 1304-1288. A bounce back of around 30 points should follow, as minor wave two. This may be a very short term trading opportunity, before the next down wave commences.
At this point I don’t see any compelling contrary data to suggest that this not a corrective ABC waveform, with C underway. Wave A was 155 points down and wave C should be similar. The decline so far, as wave C, has been surprisingly rapid.


At this point I don’t see any compelling contrary data to suggest that this not a corrective ABC waveform, with C underway. Wave A was 155 points down and wave C should be similar. The decline so far, as wave C, has been surprisingly rapid.


