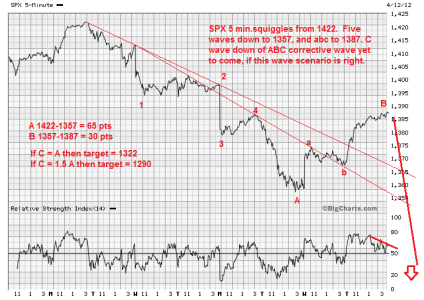
Markets over the past few sessions have appeared to be correcting, despite the bull rampage today. Indeed, a 4.5% loss was in the works near SP 500 1357 before the two day burst. The SP 500 chart shows an assumed ABC corrective pattern off the 1422 high, unfolding in minute five waves down as minor wave A. The minor B wave is underway and may or may not be finished. There is a little more wiggle room from 1388-1397 and stay within Fibonacci extremes, but resistance is just overhead. Then minor wave C down should end the correction in this ongoing bull market. Downside targets are in the range of 1284-1322, but the higher probability zone is 1293-1300 in a region of strong support. The speed of this correction in time is faster than I would like to see, and would not be surprised to see a stall for a few days.

If this is a correction consider:

If this is a correction consider:
- Using bonds as a surrogate of market activity, weekly charts show a bullish bias. RSI has been on a steady climb since mid-March from 50 to 62 on such charts as AGG or BND. For RSI, at 66 the uptrend really strengthens, and that is not too far away. Looking backwards, in July 2011, the bond charts ran up just before and concurrent with the summer correction.
- The VIX has made a higher low today. This is a precursor for a bullish surge in VIX and bearish run in the markets.
