Last week I said the Total Tracker showed we had a collective stock exposure that was under 40%. And even though the Top 50 triggered a sell signal, it was trumped by the very conservative market exposure of the entire auto tracker. Based on that (and some other indicators I track) I was fairly confident we'd see higher prices last week. And we did, as the C fund tacked on 1.29%, while the S fund soared 2.07%.
This week, the Top 50 remained largely static, while the Total Tracker showed yet another dip in stock exposure, albeit a very modest one. Still, stock exposure remains under 40% and that is suggestive of higher prices this coming week.
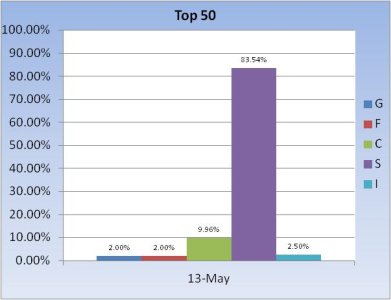
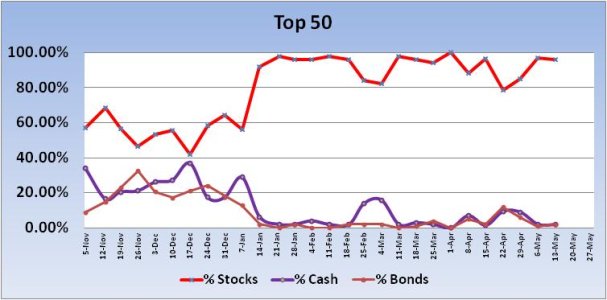
As you can see, not much changed in the Top 50 market positions.
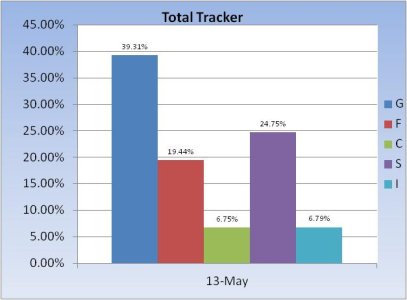
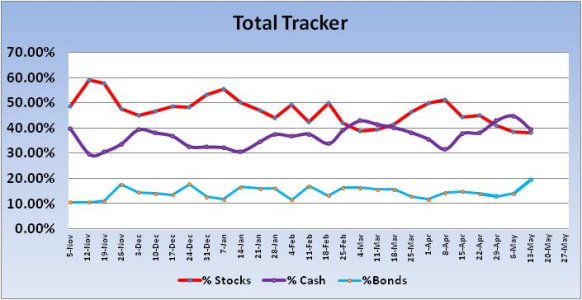
The Total Tracker shows a very modest dip in stock exposure and about a 5.5% increase in exposure to bonds (F fund), which are in a short term decline.
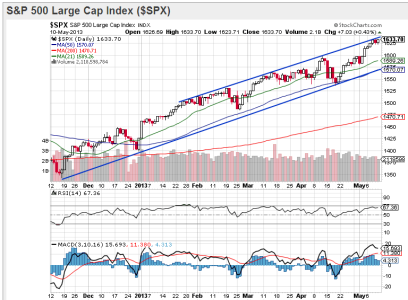
The S&P chart continues to look quite bullish as the 21, 50, and 200 day moving averages remain biased higher. RSI is strong as is MACD. Price is tracking along that upper trend line, which suggests a pull back may be near, but with the other indicators pointing higher, I can't be too bearish here.
Our sentiment survey came in at 43% bulls vs. 48% bears, which is a buy signal and that provides further evidence that the upside action will continue.
So the Total Tracker continues to show less than 40% stock exposure, we have a sentiment buy signal, and the chart of the S&P 500 looks bullish (as does the Wilshire 4500 and EAFE). I am maintaining full exposure to stocks with an even split of 50% each in the C and S funds.
This week, the Top 50 remained largely static, while the Total Tracker showed yet another dip in stock exposure, albeit a very modest one. Still, stock exposure remains under 40% and that is suggestive of higher prices this coming week.


As you can see, not much changed in the Top 50 market positions.


The Total Tracker shows a very modest dip in stock exposure and about a 5.5% increase in exposure to bonds (F fund), which are in a short term decline.

The S&P chart continues to look quite bullish as the 21, 50, and 200 day moving averages remain biased higher. RSI is strong as is MACD. Price is tracking along that upper trend line, which suggests a pull back may be near, but with the other indicators pointing higher, I can't be too bearish here.
Our sentiment survey came in at 43% bulls vs. 48% bears, which is a buy signal and that provides further evidence that the upside action will continue.
So the Total Tracker continues to show less than 40% stock exposure, we have a sentiment buy signal, and the chart of the S&P 500 looks bullish (as does the Wilshire 4500 and EAFE). I am maintaining full exposure to stocks with an even split of 50% each in the C and S funds.
